- AUD/JPY down 0.06% after failing to clear May 14 peak at 95.56.
- RSI turns slightly lower; mixed signals keep traders focused on price structure.
- Key support at 93.40/56; break below could expose 93.00 and 92.63 Senkou Span B.
The AUD/JPY retreats amid a risk-on mood, spurred by the de-escalation of the Middle East conflict. This pushed safe-haven currencies, except for the US Dollar, higher during Tuesday’s session, to the detriment of the Australian Dollar. At the time of writing, the cross-pair trades below the 94.00 figure, and is down 0.06%.
AUD/JPY Price Forecast: Technical Analysis
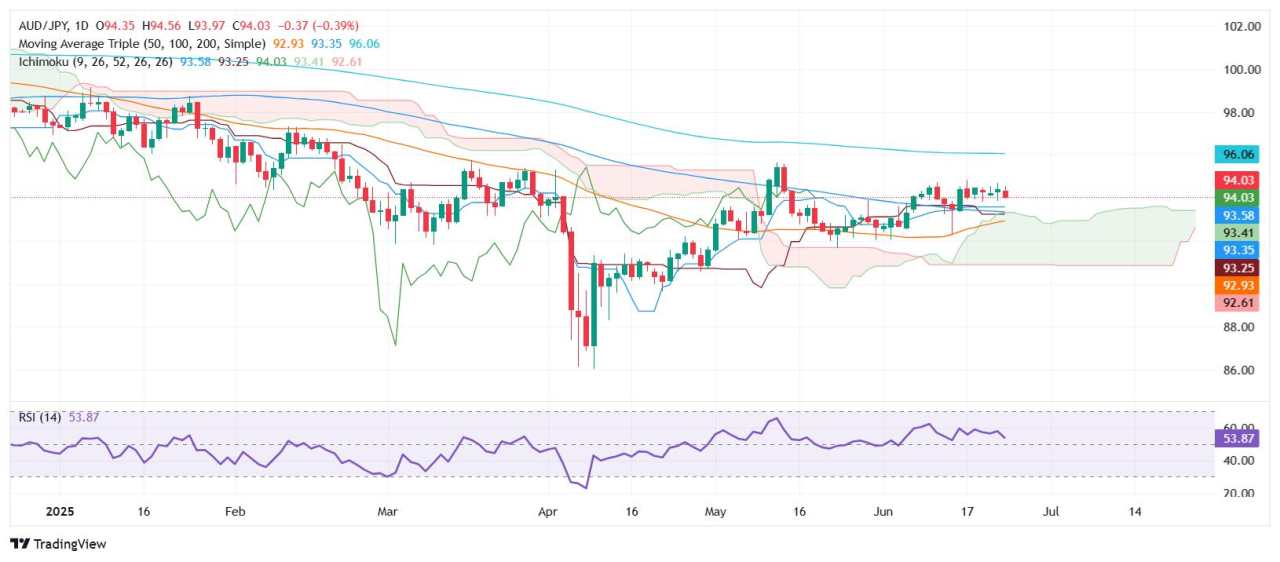
The trend remains down in the AUD/JPY cross-pair. Even though the Australian Dollar showed signs of strength, its failure to clear the May 14 peak of 95.56 pushed the pair below the 94.00 figure, although it meanders around the latter.
In the short term, the Relative Strength Index (RSI) aims slightly lower, though it remains bullish. The mixed readings leave us as traders focused on price action.
Hence, if AUD/JPY clears the confluence of the Tenkan-sen and the Senkou Span A at around 93.40/56, look for a test of the Kijun-sen at 93.23. On further weakness, 93.00 will be exposed, followed by the Senkou Span B at 92.63.
Conversely, if AUD/JPY rises past 94.00, the first resistance would be 95.00, followed by 95.56, the May 14 high. Above this level, the next zone of interest will be the 96.00 figure.
AUD/JPY Price Chart – Daily
Australian Dollar PRICE Today
The table below shows the percentage change of Australian Dollar (AUD) against listed major currencies today. Australian Dollar was the strongest against the Swiss Franc.
| USD | EUR | GBP | JPY | CAD | AUD | NZD | CHF | |
|---|---|---|---|---|---|---|---|---|
| USD | 0.00% | -0.00% | 0.00% | 0.05% | 0.00% | -0.02% | -0.04% | |
| EUR | -0.01% | -0.00% | -0.05% | 0.03% | -0.02% | -0.07% | -0.04% | |
| GBP | 0.00% | 0.00% | -0.02% | 0.02% | 0.00% | -0.07% | -0.01% | |
| JPY | 0.00% | 0.05% | 0.02% | 0.05% | 0.04% | 0.00% | 0.04% | |
| CAD | -0.05% | -0.03% | -0.02% | -0.05% | 0.00% | 0.02% | -0.05% | |
| AUD | 0.00% | 0.02% | -0.01% | -0.04% | -0.01% | -0.11% | 0.02% | |
| NZD | 0.02% | 0.07% | 0.07% | -0.01% | -0.02% | 0.11% | 0.05% | |
| CHF | 0.04% | 0.04% | 0.00% | -0.04% | 0.05% | -0.02% | -0.05% |
The heat map shows percentage changes of major currencies against each other. The base currency is picked from the left column, while the quote currency is picked from the top row. For example, if you pick the Australian Dollar from the left column and move along the horizontal line to the US Dollar, the percentage change displayed in the box will represent AUD (base)/USD (quote).
作者:Christian Borjon Valencia,文章来源FXStreet,版权归原作者所有,如有侵权请联系本人删除。
风险提示:以上内容仅代表作者或嘉宾的观点,不代表 FOLLOWME 的任何观点及立场,且不代表 FOLLOWME 同意其说法或描述,也不构成任何投资建议。对于访问者根据 FOLLOWME 社区提供的信息所做出的一切行为,除非另有明确的书面承诺文件,否则本社区不承担任何形式的责任。
FOLLOWME 交易社区网址: www.followme.ceo


加载失败()