- USD/CAD may test initial support at the eight-month low at 1.3539.
- The 14-day RSI remains below 50, strengthening bearish bias.
- The primary resistance appears at the nine-day EMA of 1.3682.
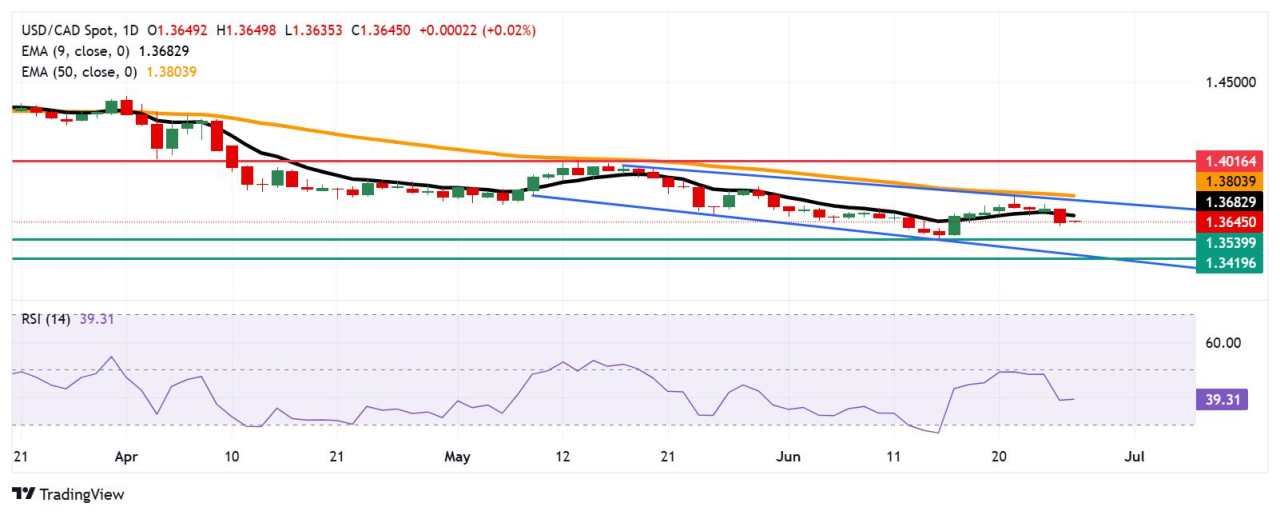
The USD/CAD pair remains steady after registering over 0.50% losses in the previous session, trading around 1.3650 during the Asian hours on Friday. A persistent bearish sentiment is prevailing as the pair moves sideways within the descending channel pattern, suggested by the technical analysis of the daily chart.
The 14-day Relative Strength Index (RSI) remains below the 50 level, reinforcing bearish pressure. Additionally, the USD/CAD pair has moved below the nine-day Exponential Moving Average (EMA), suggesting that short-term momentum is weaker.
The USD/CAD pair may find primary support near the eight-month low at 1.3539, which was recorded on June 16. A break below this level could weaken the price momentum and put downward pressure on the pair to navigate the region around the lower boundary of the descending channel around 1.3460, followed by 1.3419, the lowest since February 2024.
On the upside, the USD/CAD pair may target the primary barrier at the nine-day EMA of 1.3682. A breach above this level would strengthen the short-term price momentum and support the pair to approach the descending channel’s upper boundary around 1.3780, followed by the 50-day EMA at 1.3803. Further advances would improve the medium-term price momentum and prompt the pair to test the two-month high of 1.4016, which was reached on May 13.
USD/CAD: Daily Chart
Canadian Dollar PRICE Today
The table below shows the percentage change of Canadian Dollar (CAD) against listed major currencies today. Canadian Dollar was the strongest against the Swiss Franc.
| USD | EUR | GBP | JPY | CAD | AUD | NZD | CHF | |
|---|---|---|---|---|---|---|---|---|
| USD | 0.06% | 0.04% | 0.01% | 0.02% | 0.10% | -0.01% | 0.11% | |
| EUR | -0.06% | -0.08% | -0.07% | -0.06% | 0.00% | -0.22% | -0.01% | |
| GBP | -0.04% | 0.08% | 0.04% | -0.01% | 0.08% | -0.09% | 0.16% | |
| JPY | -0.01% | 0.07% | -0.04% | -0.01% | 0.07% | -0.22% | 0.15% | |
| CAD | -0.02% | 0.06% | 0.01% | 0.00% | 0.11% | -0.16% | 0.13% | |
| AUD | -0.10% | -0.01% | -0.08% | -0.07% | -0.11% | -0.22% | 0.08% | |
| NZD | 0.01% | 0.22% | 0.09% | 0.22% | 0.16% | 0.22% | 0.29% | |
| CHF | -0.11% | 0.01% | -0.16% | -0.15% | -0.13% | -0.08% | -0.29% |
The heat map shows percentage changes of major currencies against each other. The base currency is picked from the left column, while the quote currency is picked from the top row. For example, if you pick the Canadian Dollar from the left column and move along the horizontal line to the US Dollar, the percentage change displayed in the box will represent CAD (base)/USD (quote).
作者:Akhtar Faruqui,文章来源FXStreet_id,版权归原作者所有,如有侵权请联系本人删除。
风险提示:本文所述仅代表作者个人观点,不代表 Followme 的官方立场。Followme 不对内容的准确性、完整性或可靠性作出任何保证,对于基于该内容所采取的任何行为,不承担任何责任,除非另有书面明确说明。

暂无评论,立马抢沙发