- USD/CHF trades near 14-year lows after breaking below 0.7933; next key support lies at 0.7900.
- RSI approaches oversold but remains above extreme levels, signaling sustained bearish pressure.
- Below 0.7900 exposes 0.7710 (Sept 2011 low); resistance seen at 0.8038 and 0.8100 if recovery begins.
The Swiss Franc (CHF) surges against the US Dollar (USD) on Monday, trading at almost 14-year highs, near levels last seen in September 2011. At the time of writing, the USD/CHF plummeted to 0.7933, after hitting a multi-year low of 0.7929, down over 0.59%.
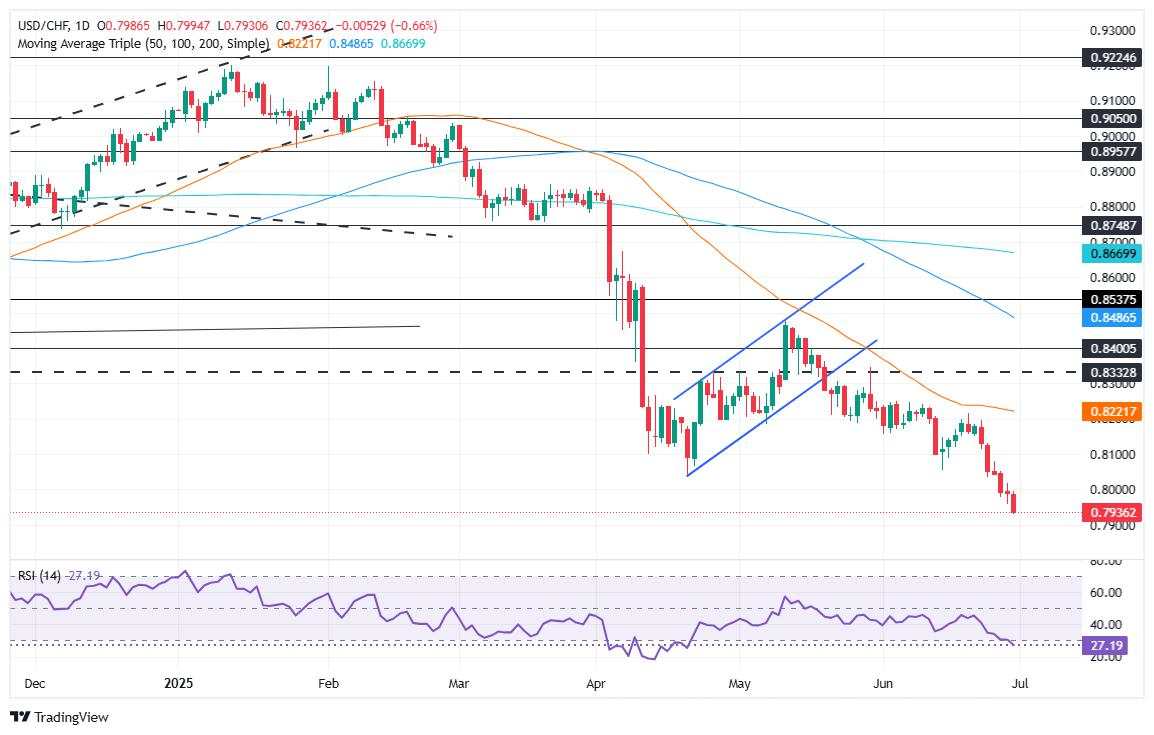
USD/CHF Price Forecast: Technical outlook
The USD/CHF has fallen over the last six trading days, poised to test the 0.7900 figure in the short term. Bears continued to exert downward pressure on the pair, as depicted by the Relative Strength Index (RSI), which edges toward oversold territory but remains above the 20 mark, considered the most extreme.
If the USD/CHF drops below 0.7900, it clears the path to test the September 2011 lows of 0.7710. Once surpassed, look for a test of the August 2011 monthly low of 0.7066.
On the flip side, if buyers regain 0.8000, this opens the door for a recovery. The first resistance zone would be the April 21 low, now turned resistance, at 0.8038, followed by 0.8050. On further strength, the next supply area will be 0.8100, followed by the 50-day SMA at 0.8217.
USD/CHF Price Chart – Daily
Swiss Franc PRICE This year
The table below shows the percentage change of Swiss Franc (CHF) against listed major currencies this year. Swiss Franc was the strongest against the US Dollar.
| USD | EUR | GBP | JPY | CAD | AUD | NZD | CHF | |
|---|---|---|---|---|---|---|---|---|
| USD | -12.12% | -8.75% | -8.36% | -5.33% | -5.93% | -8.23% | -12.57% | |
| EUR | 12.12% | 3.79% | 4.26% | 7.71% | 6.96% | 4.42% | -0.51% | |
| GBP | 8.75% | -3.79% | 0.44% | 3.79% | 3.06% | 0.61% | -4.15% | |
| JPY | 8.36% | -4.26% | -0.44% | 3.33% | 2.68% | 0.20% | -4.53% | |
| CAD | 5.33% | -7.71% | -3.79% | -3.33% | -0.75% | -3.07% | -7.65% | |
| AUD | 5.93% | -6.96% | -3.06% | -2.68% | 0.75% | -2.37% | -7.00% | |
| NZD | 8.23% | -4.42% | -0.61% | -0.20% | 3.07% | 2.37% | -4.73% | |
| CHF | 12.57% | 0.51% | 4.15% | 4.53% | 7.65% | 7.00% | 4.73% |
The heat map shows percentage changes of major currencies against each other. The base currency is picked from the left column, while the quote currency is picked from the top row. For example, if you pick the Swiss Franc from the left column and move along the horizontal line to the US Dollar, the percentage change displayed in the box will represent CHF (base)/USD (quote).
作者:Christian Borjon Valencia,文章来源FXStreet_id,版权归原作者所有,如有侵权请联系本人删除。
风险提示:本文所述仅代表作者个人观点,不代表 Followme 的官方立场。Followme 不对内容的准确性、完整性或可靠性作出任何保证,对于基于该内容所采取的任何行为,不承担任何责任,除非另有书面明确说明。


加载失败()