- EUR/CHF edges lower toward key support zone at 0.9300.
- ECB’s Lane warns of rising risks beyond tariffs, including capital controls and security-related trade barriers.
- Technical indicators reflect a fading bullish momentum as the RSI eases below 50 and the MACD histogram deepens into the red.
The Euro (EUR) weakens against the Swiss Franc (CHF) on Wednesday, with EUR/CHF trading near the lower boundary of its multi-week range around 0.9318. The cross remains under pressure following fresh comments from European Central Bank (ECB) officials that added to the cautious mood around the Euro.
Earlier today, ECB Chief Economist Philip Lane flagged an evolving set of global risks that extend beyond tariffs, highlighting non-tariff trade barriers, capital flow restrictions, and the increasing overlap between security and economic policy. Meanwhile, ECB Deputy Director-General Livio Stracca issued a stark warning that climate-related shocks could wipe out as much as 5% of eurozone GDP over the next five years, comparable in scale to the COVID-19 crisis. These comments reinforce the ECB’s cautious policy stance and could keep investor appetite for the Euro muted, against defensive currencies like the Swiss Franc.
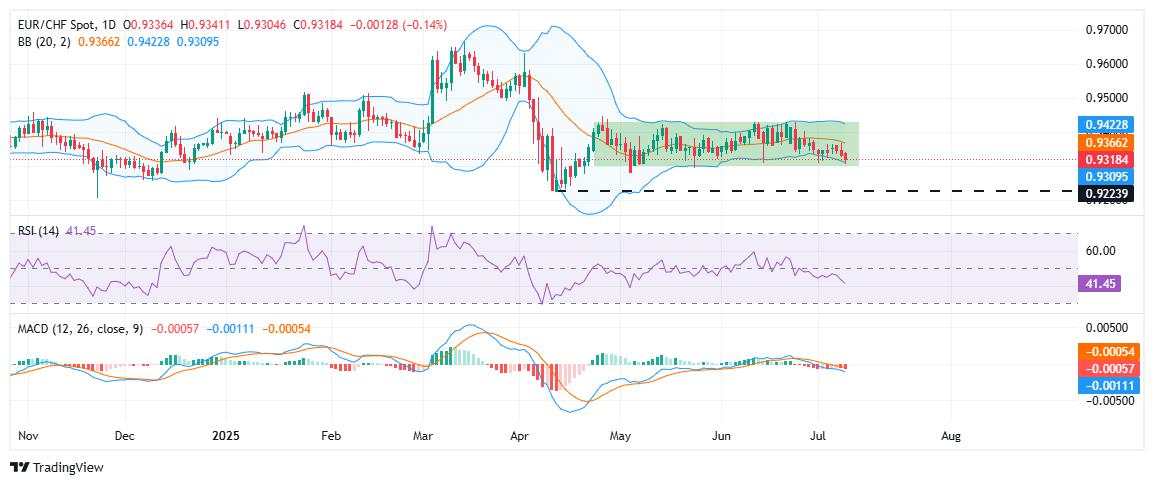
From a technical perspective, EUR/CHF remains trapped in a tight sideways range between 0.9300 and 0.9430 since late April. However, today’s decline puts the cross at risk of breaking below the 0.9300 psychological support zone.
The pair is trading just beneath the 20-day Simple Moving Average (SMA) near 0.9365, which also serves as the middle line of the Bollinger Bands, reinforcing its role as immediate resistance. The inability to reclaim this level signals a lack of bullish bias, especially as the price continues to hover near the lower Bollinger Band, indicating downward pressure.
Momentum indicators are skewed in favor of the bears. The Relative Strength Index (RSI) is slipping toward the 40 mark, indicating weakening buying interest and an increasing risk of a bearish continuation. At the same time, the Moving Average Convergence Divergence (MACD) has turned negative, with the MACD line now comfortably below the signal line and the histogram extending into red territory, indicating fading bullish momentum.
A sustained break below 0.9300 would likely confirm a bearish breakout from the recent range and could accelerate downside toward the April swing low at 0.9223, followed by the psychological 0.9200 level. On the flip side, any recovery attempt would need to clear the 20-day SMA near 0.9365 to shift the short-term bias back toward neutral. Until then, the path of least resistance appears tilted to the downside.
作者:Vishal Chaturvedi,文章来源FXStreet,版权归原作者所有,如有侵权请联系本人删除。
风险提示:以上内容仅代表作者或嘉宾的观点,不代表 FOLLOWME 的任何观点及立场,且不代表 FOLLOWME 同意其说法或描述,也不构成任何投资建议。对于访问者根据 FOLLOWME 社区提供的信息所做出的一切行为,除非另有明确的书面承诺文件,否则本社区不承担任何形式的责任。
FOLLOWME 交易社区网址: www.followme.ceo


加载失败()