- AUD/JPY has reached a five-month high at 95.81 on Friday.
- The 14-day Relative Strength Index stands at the 70 mark, indicating overbought conditions.
- The immediate support appears at the nine-day EMA of 95.59.
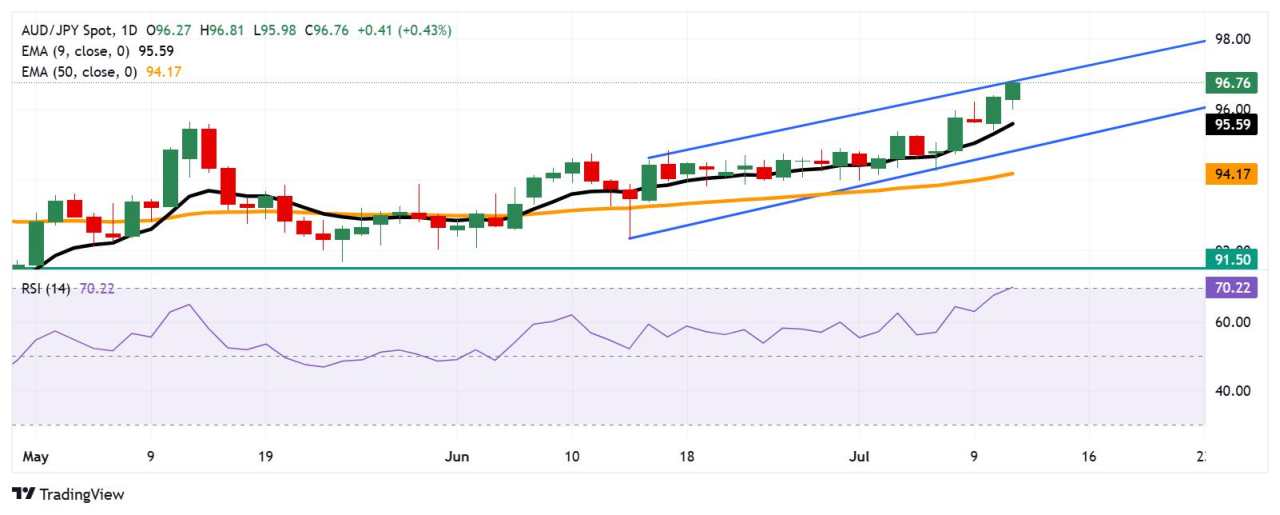
AUD/JPY extends its gains for the second successive session, trading around 96.70 during the Asian hours on Friday. As per the technical analysis of the daily chart, the currency cross remains within the ascending channel pattern, indicating a prevailing bullish bias.
The 14-day Relative Strength Index (RSI) is hovering around the 70 mark, reinforcing bullish momentum but also indicating overbought conditions, which could signal an impending downward correction. However, the AUD/JPY cross rises above the nine-day Exponential Moving Average (EMA), indicating short-term price momentum is stronger.
On the upside, the AUD/JPY cross is testing the upper boundary of the ascending channel around 96.90, marking fresh five-month highs. A successful breach above the channel could strengthen the bullish bias and prompt the currency cross to test the psychological level of 97.00.
The AUD/JPY cross may find immediate support at the nine-day EMA of 95.59. A successful break below the level would weaken the short-term price momentum and put downward pressure on the currency cross to target the ascending channel’s lower boundary around 94.80, followed by the 50-day EMA at 94.15.
AUD/JPY: Daily Chart
Australian Dollar PRICE Today
The table below shows the percentage change of Australian Dollar (AUD) against listed major currencies today. Australian Dollar was the strongest against the Japanese Yen.
| USD | EUR | GBP | JPY | CAD | AUD | NZD | CHF | |
|---|---|---|---|---|---|---|---|---|
| USD | 0.18% | 0.13% | 0.50% | 0.27% | -0.01% | 0.25% | 0.08% | |
| EUR | -0.18% | -0.06% | 0.33% | 0.09% | -0.11% | 0.06% | -0.10% | |
| GBP | -0.13% | 0.06% | 0.42% | 0.13% | -0.04% | 0.16% | -0.08% | |
| JPY | -0.50% | -0.33% | -0.42% | -0.22% | -0.52% | -0.28% | -0.45% | |
| CAD | -0.27% | -0.09% | -0.13% | 0.22% | -0.22% | -0.04% | -0.20% | |
| AUD | 0.00% | 0.11% | 0.04% | 0.52% | 0.22% | 0.31% | 0.00% | |
| NZD | -0.25% | -0.06% | -0.16% | 0.28% | 0.04% | -0.31% | -0.21% | |
| CHF | -0.08% | 0.10% | 0.08% | 0.45% | 0.20% | -0.01% | 0.21% |
The heat map shows percentage changes of major currencies against each other. The base currency is picked from the left column, while the quote currency is picked from the top row. For example, if you pick the Australian Dollar from the left column and move along the horizontal line to the US Dollar, the percentage change displayed in the box will represent AUD (base)/USD (quote).
作者:Akhtar Faruqui,文章来源FXStreet_id,版权归原作者所有,如有侵权请联系本人删除。
风险提示:本文所述仅代表作者个人观点,不代表 Followme 的官方立场。Followme 不对内容的准确性、完整性或可靠性作出任何保证,对于基于该内容所采取的任何行为,不承担任何责任,除非另有书面明确说明。

暂无评论,立马抢沙发