- EUR/JPY may find an initial barrier around the upper boundary of the rectangle at 172.50.
- The 14-day RSI is positioned above 50, indicating a prevailing bullish bias.
- The initial support appears at the nine-day EMA of 171.81.
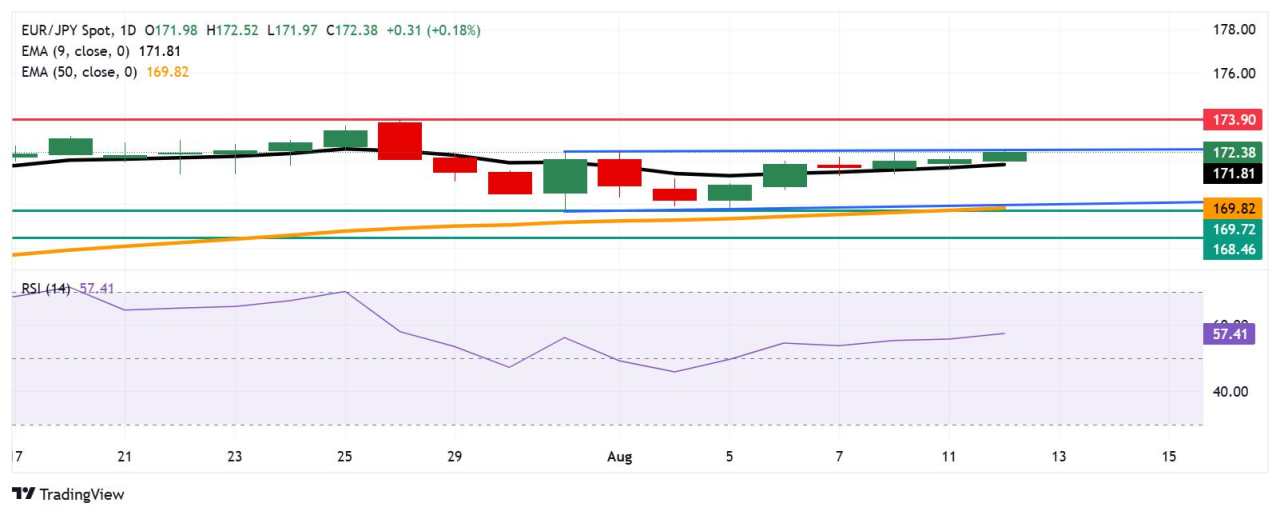
EUR/JPY extends its winning streak for the third successive session, trading around 172.40 during the European hours on Tuesday. The technical analysis of the daily chart suggests a potential for a bullish bias as the currency cross is attempting to break above the rectangular pattern.
The 14-day Relative Strength Index (RSI) is already above the 50 mark, supporting the bullish outlook. Additionally, the short-term price momentum is stronger as the EUR/JPY cross is positioned above the nine-day Exponential Moving Average (EMA).
On the upside, a successful breach above the upper boundary of the rectangle around 172.50 may offer the confirmation of the prevailing bullish sentiment and support the EUR/JPY cross to explore the region around 173.90, the highest since July 2024, recorded on July 28, 2025.
The nine-day EMA at 171.81 appears as the initial support. A break below this level would dampen the short-term price momentum and prompt the EUR/JPY cross to navigate the region around the rectangle’s lower boundary at 170.00, followed by the 50-day EMA at 169.82 and the six-week low at 169.72, which was recorded on July 31. Further support appears at, followed by the two-month low at 168.46, recorded on July 1.
EUR/JPY: Daily Chart
Euro PRICE Today
The table below shows the percentage change of Euro (EUR) against listed major currencies today. Euro was the strongest against the Australian Dollar.
| USD | EUR | GBP | JPY | CAD | AUD | NZD | CHF | |
|---|---|---|---|---|---|---|---|---|
| USD | 0.03% | -0.23% | 0.19% | 0.08% | 0.31% | 0.15% | -0.34% | |
| EUR | -0.03% | -0.24% | 0.16% | 0.08% | 0.31% | 0.15% | -0.33% | |
| GBP | 0.23% | 0.24% | 0.52% | 0.32% | 0.55% | 0.40% | -0.10% | |
| JPY | -0.19% | -0.16% | -0.52% | -0.10% | 0.10% | -0.04% | -0.43% | |
| CAD | -0.08% | -0.08% | -0.32% | 0.10% | 0.27% | 0.06% | -0.43% | |
| AUD | -0.31% | -0.31% | -0.55% | -0.10% | -0.27% | -0.17% | -0.64% | |
| NZD | -0.15% | -0.15% | -0.40% | 0.04% | -0.06% | 0.17% | -0.58% | |
| CHF | 0.34% | 0.33% | 0.10% | 0.43% | 0.43% | 0.64% | 0.58% |
The heat map shows percentage changes of major currencies against each other. The base currency is picked from the left column, while the quote currency is picked from the top row. For example, if you pick the Euro from the left column and move along the horizontal line to the US Dollar, the percentage change displayed in the box will represent EUR (base)/USD (quote).
作者:Akhtar Faruqui,文章来源FXStreet_id,版权归原作者所有,如有侵权请联系本人删除。
风险提示:本文所述仅代表作者个人观点,不代表 Followme 的官方立场。Followme 不对内容的准确性、完整性或可靠性作出任何保证,对于基于该内容所采取的任何行为,不承担任何责任,除非另有书面明确说明。

暂无评论,立马抢沙发