- The Pound weavers below the 200.00 psychological level against the Yen.
- GBP/JPY is approaching the top of a small triangle pattern.
- A break above 200.00 might send the pair towards the 201.65 area.
The Pound posted moderate gains on Monday, correcting higher after the last two days’ reversal. The pair, however, remains trapped within a tight range below the 200.00 psychological level, halfway through last week’s trading range.
The fundamental outlook is mixed. Recent UK data has given further reasons to BoE hawks to keep interest rates at current levels for some time, while in Japan, the strong GDP and Industrial Production data seen last week have cemented hopes of a further rate hike in the coming months.
Technical analysis: GBP/JPY is approaching the tip of a triangle pattern
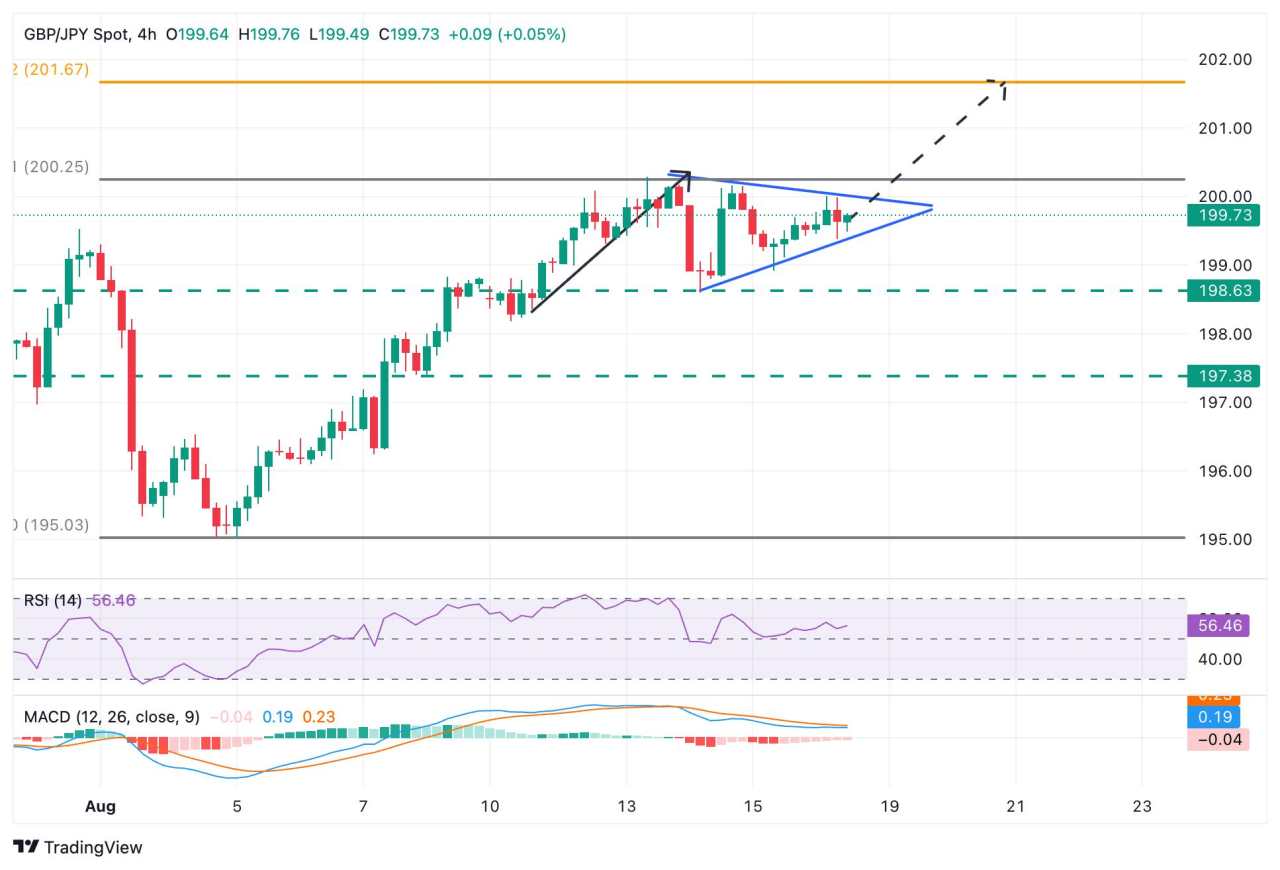
A look at the 4-hour charts and we see the pair posting lower highs and higher lows in a triangle pattern over the last trading days. This is considered a continuation pattern, which suggests that the possibility of a bullish outcome is more likely.
On the upside, trendline resistance lies at the intraday high of 200.00. A clear break of that level will bring the August 13 high, at 200.25, into focus ahead of the triangle’s measured target, at the 127,2% Fibonacci extension of the August rally, at 201.70
The Bearish outcome would require a confirmation below the base of the triangle, now at 199.30. Further down, the August 14 low, at 198.65, comes into focus. A break of that level would confirm a double top at 200.25, with the measured target near the intraday support level of 197.35.
British Pound PRICE Today
The table below shows the percentage change of British Pound (GBP) against listed major currencies today. British Pound was the strongest against the Euro.
| USD | EUR | GBP | JPY | CAD | AUD | NZD | CHF | |
|---|---|---|---|---|---|---|---|---|
| USD | 0.26% | 0.09% | 0.22% | -0.17% | -0.00% | -0.19% | 0.18% | |
| EUR | -0.26% | -0.18% | -0.05% | -0.43% | -0.25% | -0.49% | -0.09% | |
| GBP | -0.09% | 0.18% | 0.02% | -0.24% | -0.08% | -0.31% | 0.05% | |
| JPY | -0.22% | 0.05% | -0.02% | -0.37% | -0.21% | -0.39% | -0.04% | |
| CAD | 0.17% | 0.43% | 0.24% | 0.37% | 0.14% | -0.03% | 0.31% | |
| AUD | 0.00% | 0.25% | 0.08% | 0.21% | -0.14% | -0.23% | 0.15% | |
| NZD | 0.19% | 0.49% | 0.31% | 0.39% | 0.03% | 0.23% | 0.34% | |
| CHF | -0.18% | 0.09% | -0.05% | 0.04% | -0.31% | -0.15% | -0.34% |
The heat map shows percentage changes of major currencies against each other. The base currency is picked from the left column, while the quote currency is picked from the top row. For example, if you pick the British Pound from the left column and move along the horizontal line to the US Dollar, the percentage change displayed in the box will represent GBP (base)/USD (quote).
作者:Guillermo Alcala,文章来源FXStreet_id,版权归原作者所有,如有侵权请联系本人删除。
风险提示:本文所述仅代表作者个人观点,不代表 Followme 的官方立场。Followme 不对内容的准确性、完整性或可靠性作出任何保证,对于基于该内容所采取的任何行为,不承担任何责任,除非另有书面明确说明。


加载失败()