- NZD/USD may target its initial support at the lower boundary of the descending channel around 0.5770.
- The pair shows weaker short-term momentum, staying under the nine-day Exponential Moving Average.
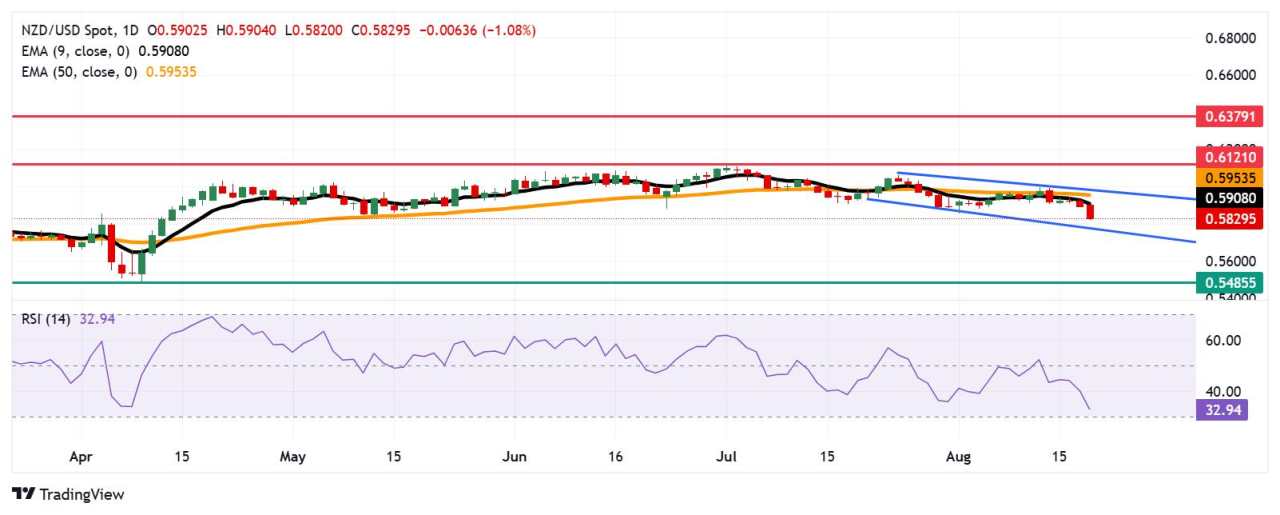
- The primary barrier appears at the nine-day EMA of 0.5908.
NZD/USD continues its three-day losing streak, trading around 0.5830 during the Asian hours on Wednesday. The pair loses ground after the Reserve Bank of New Zealand (RBNZ) announced to cut interest rates by 25 basis points, bringing the Official Cash Rate (OCR) to 3%, as expected.
The technical analysis of the daily chart indicates a persistent bearish bias, as the pair moves downwards within the descending channel pattern. The short-term price momentum is weaker as the NZD/USD pair is positioned below the nine-day Exponential Moving Average (EMA). Additionally, the bearish outlook strengthens as the 14-day Relative Strength Index (RSI) remains below the 50 mark.
On the downside, the NZD/USD pair could find its immediate support at the lower boundary of the descending channel around 0.5770. A break below the channel could reinforce the bearish bias and pave the way for a deeper decline toward 0.5485, the lowest level since March 2020.
The NZD/USD pair may target the primary barrier at the nine-day EMA of 0.5908, followed by the 50-day EMA at 0.5953 and the descending channel’s upper boundary around 0.5980. A break above this confluence resistance zone may improve the short- and medium-term price momentum and support the pair to approach the 10-month high at 0.6121, which was recorded on July 1.
NZD/USD: Daily Chart
New Zealand Dollar PRICE Today
The table below shows the percentage change of New Zealand Dollar (NZD) against listed major currencies today. New Zealand Dollar was the weakest against the Japanese Yen.
| USD | EUR | GBP | JPY | CAD | AUD | NZD | CHF | |
|---|---|---|---|---|---|---|---|---|
| USD | 0.10% | 0.12% | 0.00% | 0.03% | 0.33% | 1.21% | 0.07% | |
| EUR | -0.10% | 0.01% | -0.22% | -0.07% | 0.26% | 1.04% | -0.05% | |
| GBP | -0.12% | -0.01% | -0.20% | -0.09% | 0.17% | 0.93% | -0.06% | |
| JPY | 0.00% | 0.22% | 0.20% | 0.12% | 0.42% | 1.27% | 0.27% | |
| CAD | -0.03% | 0.07% | 0.09% | -0.12% | 0.33% | 1.19% | 0.04% | |
| AUD | -0.33% | -0.26% | -0.17% | -0.42% | -0.33% | 0.76% | -0.23% | |
| NZD | -1.21% | -1.04% | -0.93% | -1.27% | -1.19% | -0.76% | -1.06% | |
| CHF | -0.07% | 0.05% | 0.06% | -0.27% | -0.04% | 0.23% | 1.06% |
The heat map shows percentage changes of major currencies against each other. The base currency is picked from the left column, while the quote currency is picked from the top row. For example, if you pick the New Zealand Dollar from the left column and move along the horizontal line to the US Dollar, the percentage change displayed in the box will represent NZD (base)/USD (quote).
作者:Akhtar Faruqui,文章来源FXStreet_id,版权归原作者所有,如有侵权请联系本人删除。
风险提示:本文所述仅代表作者个人观点,不代表 Followme 的官方立场。Followme 不对内容的准确性、完整性或可靠性作出任何保证,对于基于该内容所采取的任何行为,不承担任何责任,除非另有书面明确说明。


加载失败()