USD: Sept '25 is Up at 98.590.
Energies: Sep '25 Crude is Up at 63.67.
Financials: The Sep '25 30 Year T-Bond is Higher by 1 tick and trading at 114.03.
Indices: The Sep '25 S&P 500 emini ES contract is 48 ticks Higher and trading at 6400.00.
Gold: The Dec'25 Gold contract is trading Down at 3371.00.
Initial conclusion
This is not a correlated market. The USD is Up and Crude is Up which is not normal, and the 30 Year T-Bond is trading fractionally Higher. The Financials should always correlate with the US dollar such that if the dollar is Higher, then the bonds should follow and vice-versa. The S&P is Higher and Crude is trading Higher which is not correlated. Gold is trading Lower which is correlated with the US dollar trading Up. I tend to believe that Gold has an inverse relationship with the US Dollar as when the US Dollar is down, Gold tends to rise in value and vice-versa. Think of it as a seesaw, when one is up the other should be down. I point this out to you to make you aware that when we don't have a correlated market, it means something is wrong. As traders you need to be aware of this and proceed with your eyes wide open. Asia traded Mixed. Currently all of Europe is trading Higher except the German Dax.
Possible challenges to traders
- FOMC Member Collins Speaks at 9 AM EST. This is Major.
- Fed Chair Powell Speaks at 10 AM EST. This is Major.
- Jackson Hole Symposium - All Day. This is Major.
Traders, please note that we've changed the Bond instrument from the 10 Year (ZN) to the 2 Year (ZT). They work exactly the same.
We've elected to switch gears a bit and show correlation between the 2-year Treasury notes (ZT) and the S&P futures contract. The YM contract is the Dow Jones Industrial Average, and the purpose is to show reverse correlation between the two instruments. Remember it's likened to a seesaw, when up goes up the other should go down and vice versa.
Yesterday the ZT dived Lower at around 8:30 AM EST with Unemployment Claims pending. The Dow climbed Higher at the same time. Look at the charts below and you'll see a pattern for both assets. The Dow climbed Higher at around 8:30 AM EST and the ZT dived Lower at around the same time. These charts represent the newest version of Bar Charts, and I've changed the timeframe to a 15-minute chart to display better. This represented a Short opportunity on the 2-year note, as a trader you could have netted about 20 ticks per contract on this trade. Each tick is worth $6.25. Please note: the front month for ZT is now Sep '25 and the Dow is now Sep '25. I've changed the format to filled Candlesticks (not hollow) such that it may be more apparent and visible.
Charts courtesy of barcharts
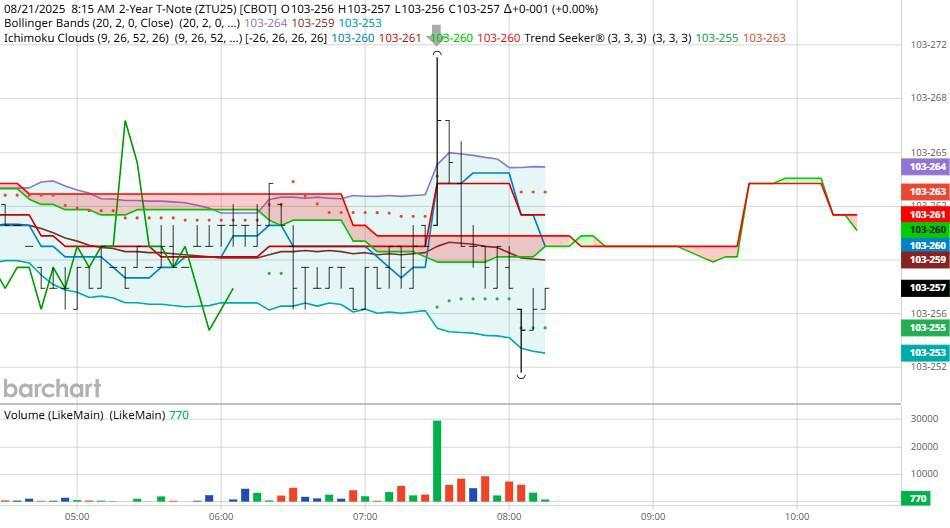
ZT -Sep 25 - 8/21/25
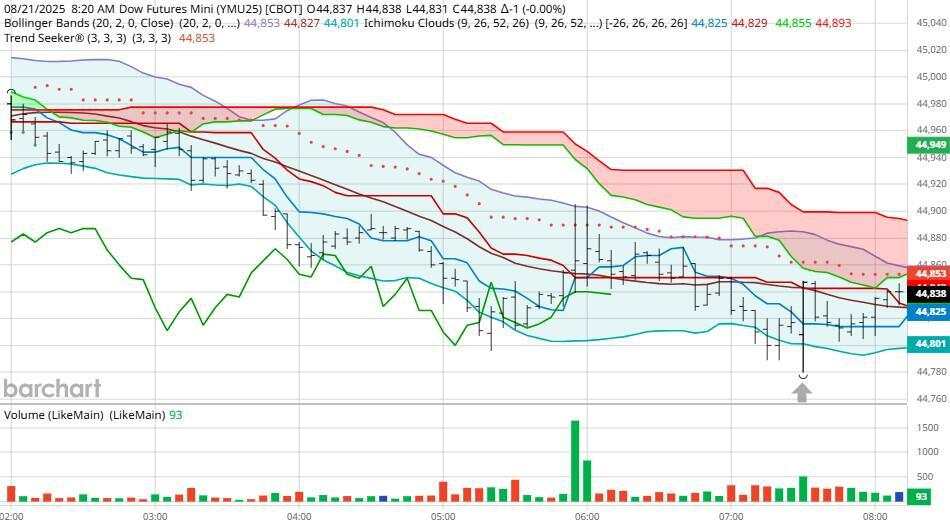
Dow - Sep 2025- 8/21/25
Bias
Yesterday we gave the markets a Neutral or Mixed bias which means the markets could go anywhere and yesterday it dropped Lower. The Dow dropped 153 points, and the S&P and Nasdaq also lost ground. The Russell however did manage a gain. Today our bias is Mixed.
Could this change? Of Course. Remember anything can happen in a volatile market.
Commentary
So this week we've witnessed meeting after meeting and a global summit yet the markets haven't fared well in light of this. I think someone needs to wake Trump out of the notion that Putin will keep his word, as he has never kept it.
作者:Nick Mastrandrea,文章来源FXStreet,版权归原作者所有,如有侵权请联系本人删除。
风险提示:本文所述仅代表作者个人观点,不代表 Followme 的官方立场。Followme 不对内容的准确性、完整性或可靠性作出任何保证,对于基于该内容所采取的任何行为,不承担任何责任,除非另有书面明确说明。


加载失败()