In this technical article we’re going to look at the Elliott Wave charts of Dollar index DXY published in members area of the website. US Dollar has recently given us Double Three pull back and found buyers again precisely at the equal legs area as we expected. In this discussion, we’ll break down the Elliott Wave pattern and forecast.
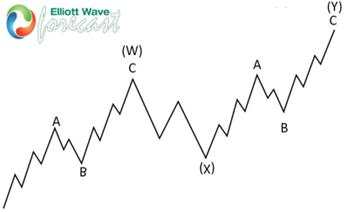
Elliott Wave double three pattern
Double three is the common pattern in the market , also known as 7 swing structure. It’s a reliable pattern which is giving us good trading entries with clearly defined invalidation levels.
The picture below presents what Elliott Wave Double Three pattern looks like. It has (W),(X),(Y) labeling and 3,3,3 inner structure, which means all of these 3 legs are corrective sequences. Each (W) and (Y) are made of 3 swings , they’re having A,B,C structure in lower degree, or alternatively they can have W,X,Y labeling.
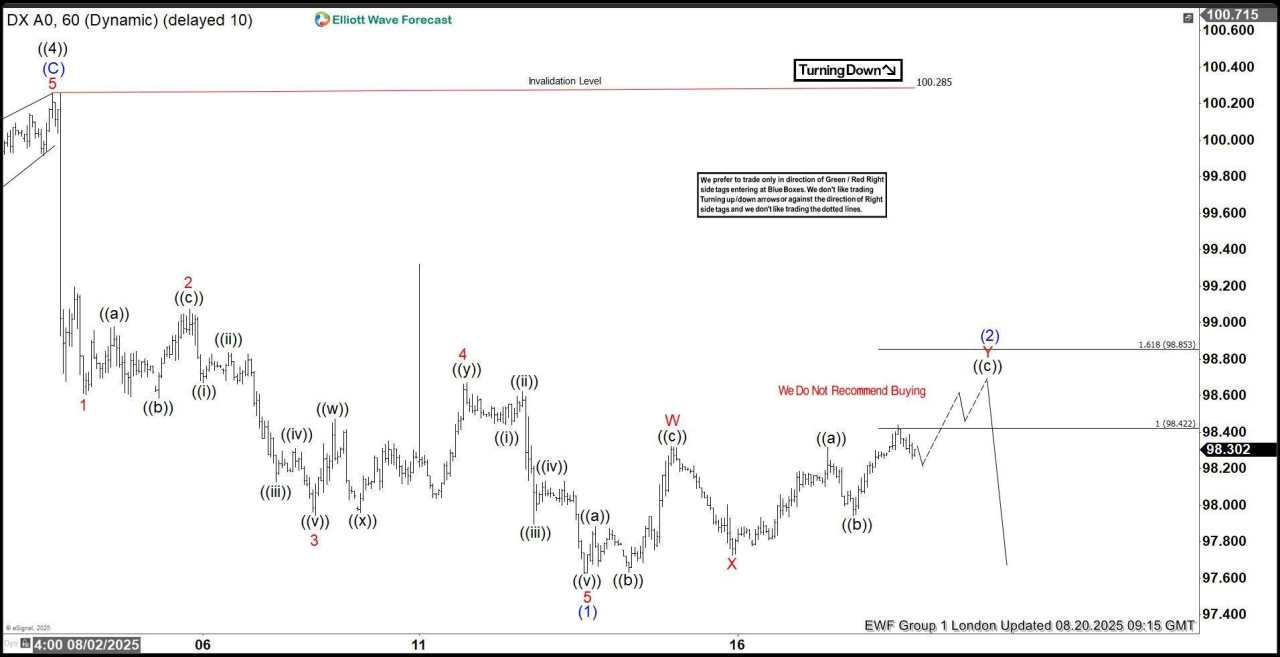
DXY Elliott Wave one-hour chart 08.20.2025
DXY is forming a Double Three pattern. Our members know that we identify potential reversal zones using the Equal Legs technique — in this case, the sellers’ area lies at 98.422–98.853. The dollar may see further upside in the near term within this zone. As long as the price stays within this region, we expect sellers to take control and push it down toward new lows. We recommended that members avoid buying the Dollar at this stage, while favoring the short side.
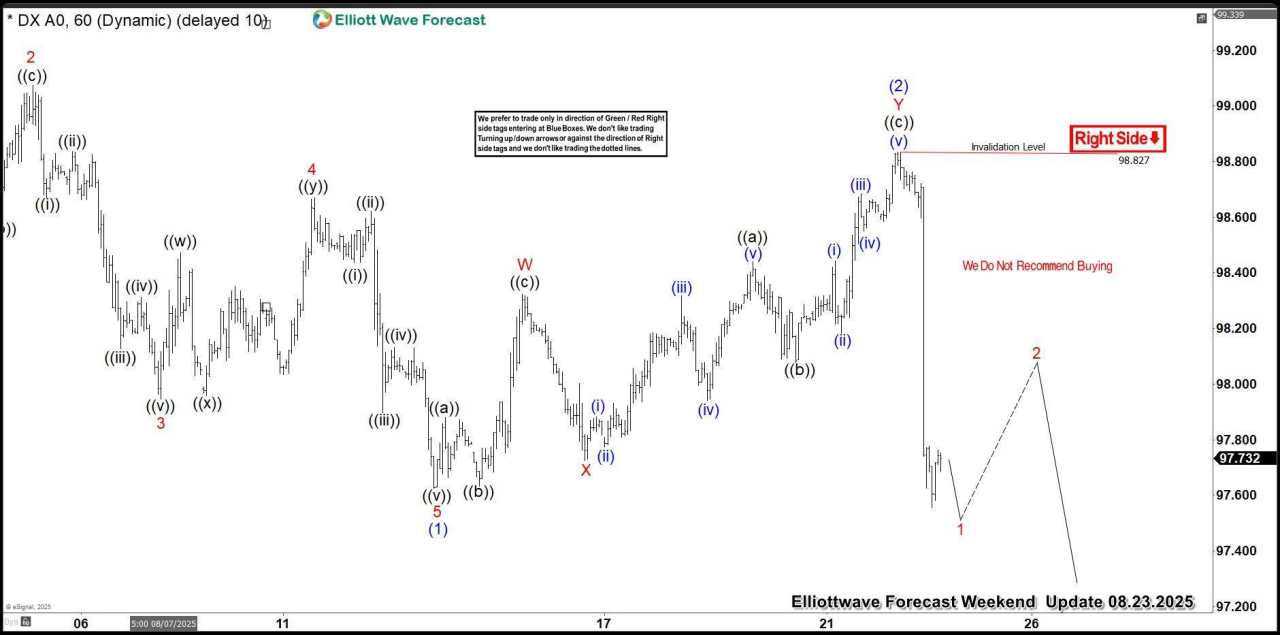
DXY Elliott Wave one-hour chart 08.20.2025
A few days later, we can see the result. The Dollar found sellers at the marked Equal Legs zone, as expected. DXY made a sharp drop from the sellers’ zone. The recovery peaked at 98.827. As long as it remains below that high, the next leg down may be in progress.
作者:Elliott Wave Forecast Team,文章来源FXStreet,版权归原作者所有,如有侵权请联系本人删除。
风险提示:本文所述仅代表作者个人观点,不代表 Followme 的官方立场。Followme 不对内容的准确性、完整性或可靠性作出任何保证,对于基于该内容所采取的任何行为,不承担任何责任,除非另有书面明确说明。


加载失败()