In this technical article we’re going to look at the Elliott Wave charts of EURUSD forex pair published in members area of the website. The pair has recently given us Double Three pull back and found buyers again precisely at the equal legs area as we expected. In the following text, we’ll explain the Elliott Wave count.
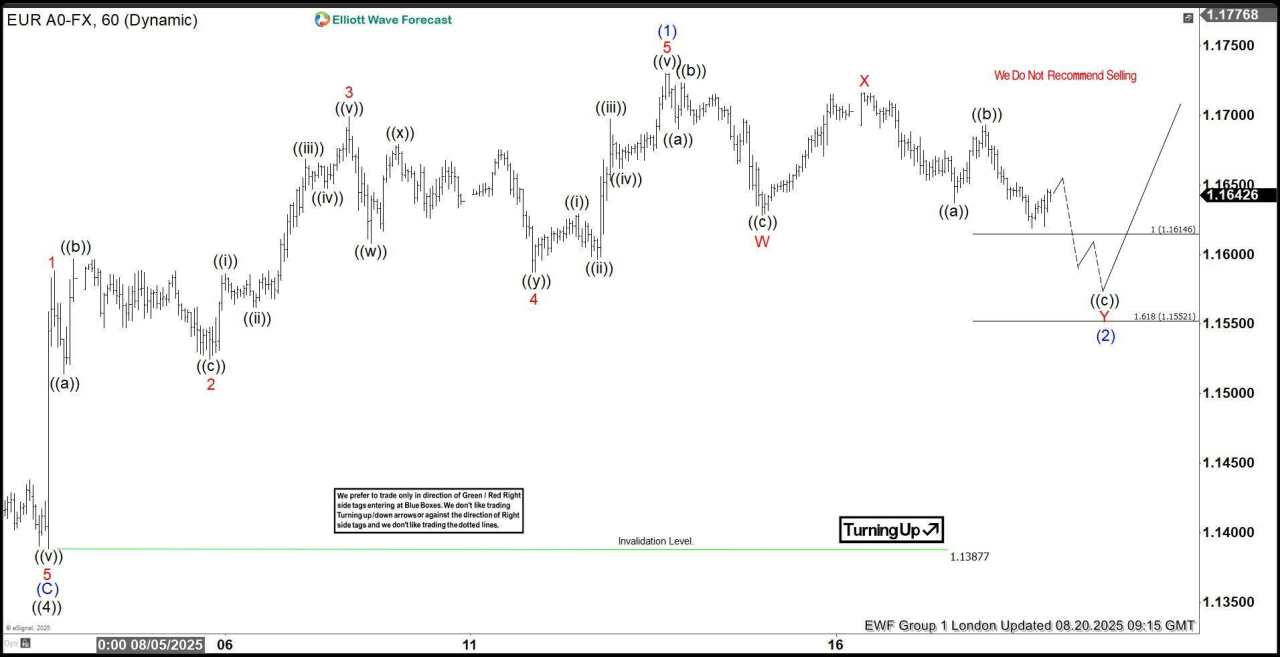
EUR/USD Elliott Wave one-hour chart 08.20.2025
EURUSD is currently developing an intraday three-wave pullback from recent highs. Our members know how to identify potential reversal zones using the Equal Legs technique — in this case, the ideal support area comes in at 1.16146-1.15521. The pair can see more downside in near term. As long as price holds within this region, we expect buyers to step in and rally to resume.
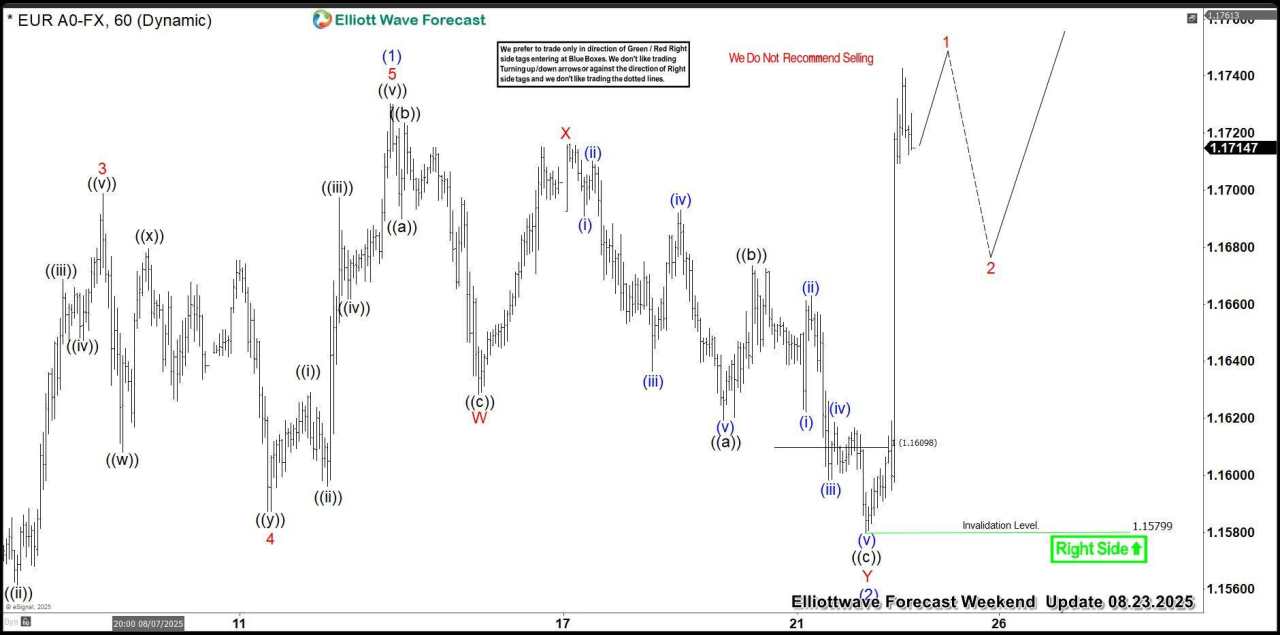
EUR/USD Elliott Wave one-hour chart 08.20.2025
The pair has reached our target area and found buyers as expected. EURUSD made strong rally from the buyers zone and completed pull back at the 1.15799 low. We do not recommend selling the pair at this stage and favor the long side. 1.15799 is the key low for proposed short term view. While above that low, next leg up can be in progress.
作者:Elliott Wave Forecast Team,文章来源FXStreet,版权归原作者所有,如有侵权请联系本人删除。
风险提示:本文所述仅代表作者个人观点,不代表 Followme 的官方立场。Followme 不对内容的准确性、完整性或可靠性作出任何保证,对于基于该内容所采取的任何行为,不承担任何责任,除非另有书面明确说明。


加载失败()