- USD/JPY posts minimal gains after August’s 2.4% drop, trading at 147.28 amid thin holiday volumes.
- US appeals court ruled Trump’s tariffs illegal, but duties remain as case heads toward Supreme Court.
- Traders price 90% chance of September Fed cut: BoJ rate hike odds steady at 50% amid soft inflation.
The USD/JPY posted minimal gains on Monday after losing over 2.40% in August amid thin trading, with US markets closed in observance of Labor Day. The pair trades at 147.28 as the Greenback continues to weaken amid news that the US Court of Appeals has ruled Trump's tariffs illegal.
Dollar weakens despite court ruling on Trump tariffs; traders await ISM PMI and critical Nonfarm Payrolls
Despite its decision, the US federal court kept tariffs in place as the fight escalated to the US Supreme Court. The status of Trump's early agreements with Japan and South Korea is unclear, as the imposed duties were deemed illegal. Nevertheless, most analysts agreed that the court’s decision will not mark the end of the trade war.
Aside from this, traders await the release of the ISM Manufacturing PMI over the week, along with a crucial Nonfarm Payrolls report, which could cement the case for an interest rate cut by the Federal Reserve.
Money market futures had priced in a 90% chance that the Fed Chair Jerome Powell and Co. would reduce rates by 25 basis points, according to the Prime Market Terminal (PMT) interest rate probabilities tool.
On the Japanese front, the lack of Tier 1 releases and trade uncertainty between the US and Japan are weighing on the Japanese Yen as the top trade negotiator postponed his trip to the US due to a disagreement regarding rice purchases.
Last week, Tokyo's core inflation fell to 2.5% in August from 2.9%, matching estimates. The BoJ’s rate hike odds stand at 50%, according to the PMT tool.
USD/JPY Price Forecast: Terminal outlook
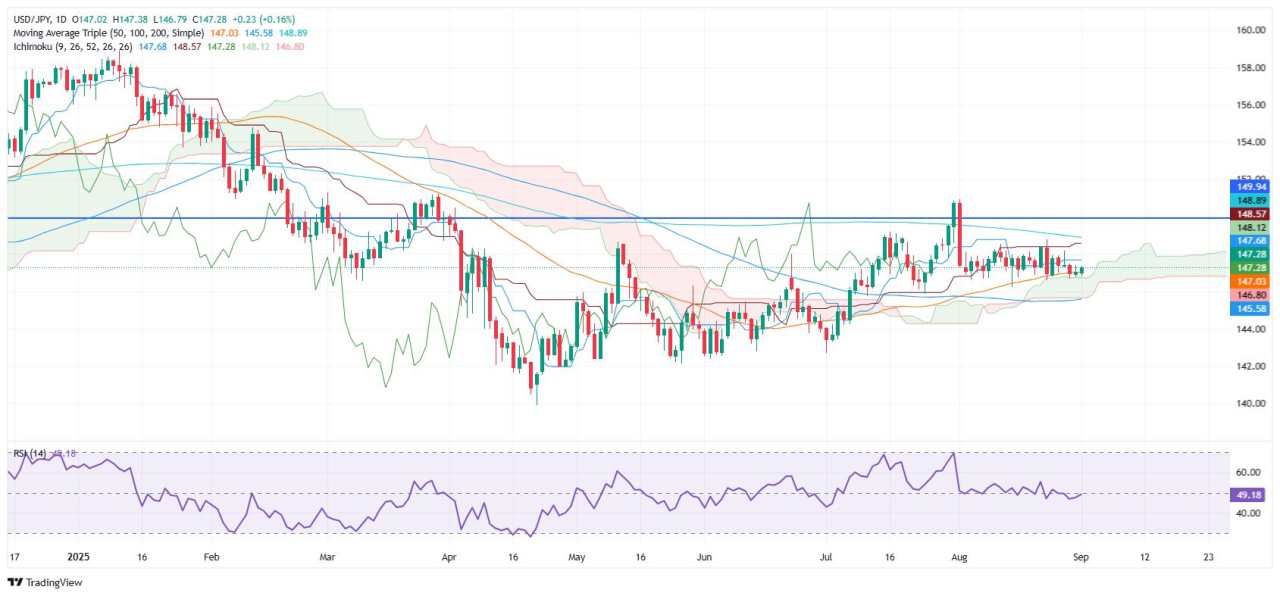
The USD/JPY daily chart suggests the pair might continue to consolidate, within the 146.66 – 148.18 range, unless a fresh catalyst —which could be NFP data— could trigger a breach below/above the boundaries set by traders.
If the pair climbs past 148.00, the first resistance would be August’s 27 high of 148.18. Once cleared, the next area of interest would be the 200-day Simple Moving Average (SMA) at 148.85 ahead of 149.00. On the other hand, a drop below the 50-day SMA at 147.00 will expose the August 28 low of 146.66, followed by August’s monthly low of 146.21.
Japanese Yen Price Last 30 days
The table below shows the percentage change of Japanese Yen (JPY) against listed major currencies last 30 days. Japanese Yen was the strongest against the US Dollar.
| USD | EUR | GBP | JPY | CAD | AUD | NZD | CHF | |
|---|---|---|---|---|---|---|---|---|
| USD | -2.38% | -2.49% | -2.30% | -0.64% | -1.86% | 0.00% | -1.36% | |
| EUR | 2.38% | -0.02% | 0.10% | 1.85% | 0.66% | 2.30% | 1.11% | |
| GBP | 2.49% | 0.02% | 0.14% | 1.87% | 0.68% | 2.54% | 1.15% | |
| JPY | 2.30% | -0.10% | -0.14% | 1.68% | 0.44% | 2.24% | 0.96% | |
| CAD | 0.64% | -1.85% | -1.87% | -1.68% | -1.25% | 0.66% | -0.70% | |
| AUD | 1.86% | -0.66% | -0.68% | -0.44% | 1.25% | 1.84% | 0.59% | |
| NZD | -0.01% | -2.30% | -2.54% | -2.24% | -0.66% | -1.84% | -1.25% | |
| CHF | 1.36% | -1.11% | -1.15% | -0.96% | 0.70% | -0.59% | 1.25% |
The heat map shows percentage changes of major currencies against each other. The base currency is picked from the left column, while the quote currency is picked from the top row. For example, if you pick the Japanese Yen from the left column and move along the horizontal line to the US Dollar, the percentage change displayed in the box will represent JPY (base)/USD (quote).
作者:Christian Borjon Valencia,文章来源FXStreet_id,版权归原作者所有,如有侵权请联系本人删除。
风险提示:本文所述仅代表作者个人观点,不代表 Followme 的官方立场。Followme 不对内容的准确性、完整性或可靠性作出任何保证,对于基于该内容所采取的任何行为,不承担任何责任,除非另有书面明确说明。

暂无评论,立马抢沙发