Reason to trust

How Our News is Made
Strict editorial policy that focuses on accuracy, relevance, and impartiality
Ad discliamer
Morbi pretium leo et nisl aliquam mollis. Quisque arcu lorem, ultricies quis pellentesque nec, ullamcorper eu odio.
Bitcoin price is struggling to recover above $112,500. BTC is now consolidating and might decline if there is a move below the $110,800 level.
- Bitcoin started a recovery wave above the $110,800 zone.
- The price is trading above $111,000 and the 100 hourly Simple moving average.
- There is a bullish trend line forming with support at $110,800 on the hourly chart of the BTC/USD pair (data feed from Kraken).
- The pair might start another decline if it stays below the $113,000 zone.
Bitcoin Price Faces Key Hurdles
Bitcoin price started a fresh recovery wave from the $110,000 zone. BTC managed to climb above the $110,800 and $111,200 resistance levels.
The bulls were able to push the price above the 50% Fib retracement level of the key decline from the $113,372 swing high to the $110,039 low. However, the bears remained active near the $112,600 zone and prevented more gains.
The 76.4% Fib retracement level of the key decline from the $113,372 swing high to the $110,039 low acted as a resistance. Bitcoin is now trading above $111,000 and the 100 hourly Simple moving average. Besides, there is a bullish trend line forming with support at $110,800 on the hourly chart of the BTC/USD pair.
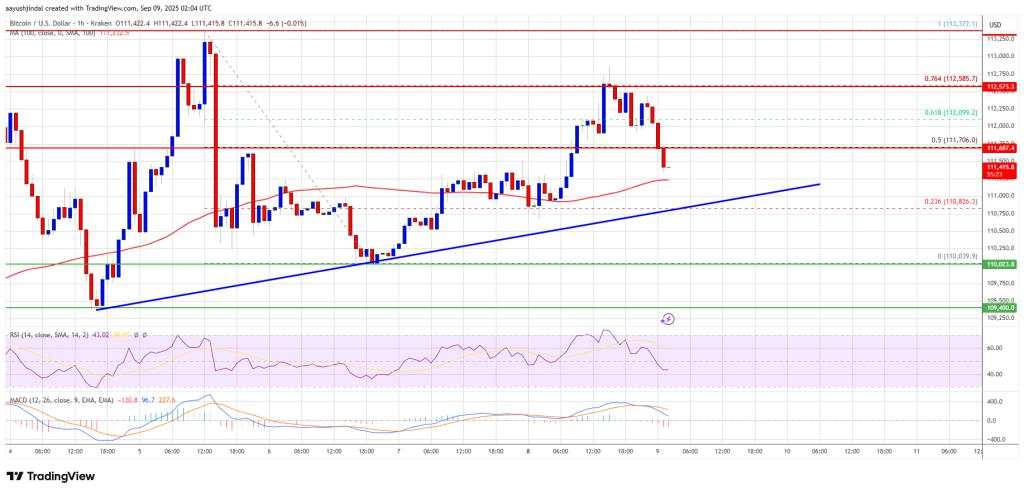
Immediate resistance on the upside is near the $111,750 level. The first key resistance is near the $112,000 level. The next resistance could be $112,550. A close above the $112,550 resistance might send the price further higher. In the stated case, the price could rise and test the $113,000 resistance level. Any more gains might send the price toward the $114,200 level. The main target could be $115,000.
Another Decline In BTC?
If Bitcoin fails to rise above the $112,550 resistance zone, it could start a fresh decline. Immediate support is near the $110,800 level and the trend line. The first major support is near the $110,500 level.
The next support is now near the $110,000 zone. Any more losses might send the price toward the $108,800 support in the near term. The main support sits at $107,500, below which BTC might decline sharply.
Technical indicators:
Hourly MACD – The MACD is now losing pace in the bullish zone.
Hourly RSI (Relative Strength Index) – The RSI for BTC/USD is now below the 50 level.
Major Support Levels – $110,800, followed by $110,000.
Major Resistance Levels – $112,550 and $113,000.
作者:fxco_id,文章来源fxco_id,版权归原作者所有,如有侵权请联系本人删除。
风险提示:本文所述仅代表作者个人观点,不代表 Followme 的官方立场。Followme 不对内容的准确性、完整性或可靠性作出任何保证,对于基于该内容所采取的任何行为,不承担任何责任,除非另有书面明确说明。


加载失败()