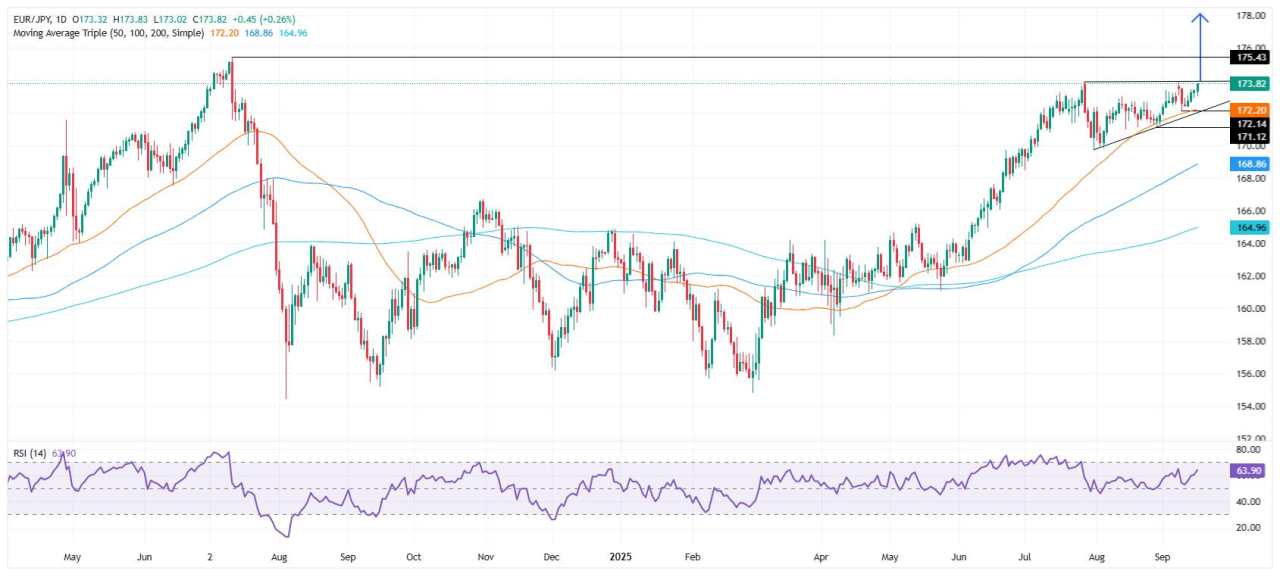
- EUR/JPY extends rally for second day, trading at 173.80 with bullish technical setup reinforcing upside potential.
- Ascending triangle formation in uptrend suggests buyers could target 174.00, 175.43, and eventually 178.00.
- BoJ hawkish stance to raise rates caps gains, though RSI strength supports continued bullish momentum.
The EUR/JPY trends higher for the second straight day, hits a six-day high of 173.83 as the technical picture, suggests that further upside is seen. At the time of writing, the cross-pair trades at 173.80, up 0.25%.
EUR/JPY Price Forecast: Technical outlook
The formation of an “ascending triangle” in an uptrend, suggests that the EUR/JPY is poised to extend its rally, and post gains of over 300 pips with buyers targeting the 178.00 figure. Nevertheless, fundamental reasons, like the Bank of Japan (BoJ) telegraphing hawkish intentions to hike rates, according to sources, capped the pair’s advance.
The Relative Strength Index (RSI) is bullish and about to clear the latest peak at 64.92, would indicate that flows could push the EUR/JPY higher.
In that outcome, the EUR/JPY first resistance would be 174.00, followed by July 11, 2024, peak at 175.43. On further strength, the next resistance will be 176.00 and subsequently 177.00 and 178.00, the “ascending triangle’s objective.”
EUR/JPY Price Chart – Daily
Euro Price This week
The table below shows the percentage change of Euro (EUR) against listed major currencies this week. Euro was the strongest against the US Dollar.
| USD | EUR | GBP | JPY | CAD | AUD | NZD | CHF | |
|---|---|---|---|---|---|---|---|---|
| USD | -1.12% | -0.71% | -0.79% | -0.69% | -0.61% | -0.63% | -1.30% | |
| EUR | 1.12% | 0.44% | 0.28% | 0.44% | 0.56% | 0.46% | -0.18% | |
| GBP | 0.71% | -0.44% | -0.10% | 0.00% | 0.12% | 0.02% | -0.74% | |
| JPY | 0.79% | -0.28% | 0.10% | 0.08% | 0.23% | 0.15% | -0.50% | |
| CAD | 0.69% | -0.44% | 0.00% | -0.08% | 0.19% | 0.01% | -0.73% | |
| AUD | 0.61% | -0.56% | -0.12% | -0.23% | -0.19% | -0.10% | -0.78% | |
| NZD | 0.63% | -0.46% | -0.02% | -0.15% | -0.01% | 0.10% | -0.75% | |
| CHF | 1.30% | 0.18% | 0.74% | 0.50% | 0.73% | 0.78% | 0.75% |
The heat map shows percentage changes of major currencies against each other. The base currency is picked from the left column, while the quote currency is picked from the top row. For example, if you pick the Euro from the left column and move along the horizontal line to the US Dollar, the percentage change displayed in the box will represent EUR (base)/USD (quote).
作者:Christian Borjon Valencia,文章来源FXStreet_id,版权归原作者所有,如有侵权请联系本人删除。
风险提示:本文所述仅代表作者个人观点,不代表 Followme 的官方立场。Followme 不对内容的准确性、完整性或可靠性作出任何保证,对于基于该内容所采取的任何行为,不承担任何责任,除非另有书面明确说明。

暂无评论,立马抢沙发