- USD/CHF rejected at 20-day SMA near 0.7970, slipping beneath 0.7950 support in early-week trading.
- Bearish RSI tilt and “dark cloud cover” pattern increase probability of revisiting last Friday’s 0.7911 low.
- Break below 0.7911 could expose yearly trough at 0.7829, while recovery above 0.8000 would ease downside bias.
The USD/CHF retreats on Monday as the technical picture suggest the downtrend might resume in the near term. At the time of writing, the pair trades at 0.7923 below the 0.8000 figure, poised to test yearly lows of 0.7829.
USD/CHF Price Forecast: Technical outlook
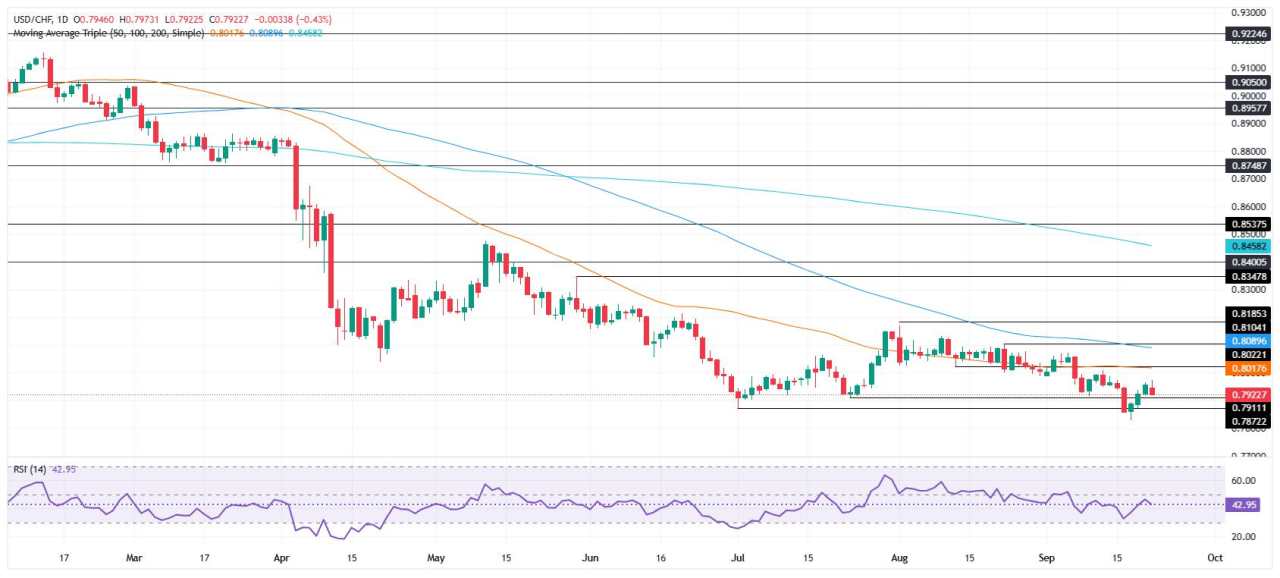
The USD/CHF failed to clear strong resistance at the 20-day SMA at 0.7970 and fell below 0.7950. The formation of a ‘dark cloud cover’ chart pattern, paves the way for further downside. However, sellers need to surpass last Friday’s low of 0.7911, which clears the path to test the yearly low.
From a momentum standpoint, the Relative Strength Index (RSI) aims lower and remains in bearish territory, increasing the likelihood of the USD/CHF testing lower prices.
Conversely, if USD/CHF climbs above 0.7950 and clears 0.7970 and 0.8000, this will increase bulls momentum, to challenge the 50-day SMA At 0.8015.
USD/CHF Price Chart – Daily
Swiss Franc Price This Month
The table below shows the percentage change of Swiss Franc (CHF) against listed major currencies this month. Swiss Franc was the strongest against the Canadian Dollar.
| USD | EUR | GBP | JPY | CAD | AUD | NZD | CHF | |
|---|---|---|---|---|---|---|---|---|
| USD | -0.89% | -0.14% | 0.47% | 0.65% | -0.79% | 0.37% | -0.91% | |
| EUR | 0.89% | 0.76% | 1.32% | 1.55% | 0.10% | 1.27% | -0.02% | |
| GBP | 0.14% | -0.76% | 0.44% | 0.79% | -0.65% | 0.52% | -0.72% | |
| JPY | -0.47% | -1.32% | -0.44% | 0.24% | -1.25% | -0.07% | -1.35% | |
| CAD | -0.65% | -1.55% | -0.79% | -0.24% | -1.42% | -0.27% | -1.50% | |
| AUD | 0.79% | -0.10% | 0.65% | 1.25% | 1.42% | 1.18% | -0.07% | |
| NZD | -0.37% | -1.27% | -0.52% | 0.07% | 0.27% | -1.18% | -1.23% | |
| CHF | 0.91% | 0.02% | 0.72% | 1.35% | 1.50% | 0.07% | 1.23% |
The heat map shows percentage changes of major currencies against each other. The base currency is picked from the left column, while the quote currency is picked from the top row. For example, if you pick the Swiss Franc from the left column and move along the horizontal line to the US Dollar, the percentage change displayed in the box will represent CHF (base)/USD (quote).
作者:Christian Borjon Valencia,文章来源FXStreet,版权归原作者所有,如有侵权请联系本人删除。
风险提示:本文所述仅代表作者个人观点,不代表 Followme 的官方立场。Followme 不对内容的准确性、完整性或可靠性作出任何保证,对于基于该内容所采取的任何行为,不承担任何责任,除非另有书面明确说明。


加载失败()