- Gold ticks down from all-time highs, at $3,790, weighed by a stronger US Dollar.
- Fed Powell affirmed that the central bank will move slowly with rate cuts.
- XAU/USD seems ready for a bearish correction after having rallied 15% from mid-August lows.
Gold is trading with moderate losses on Wednesday, snapping a three-day winning streak amid a somewhat firmer US Dollar. The Precious metal has returned to the $3,760 area, although it remains at a short distance from the $3,791 record high reached on Tuesday.
The US Dollar is drawing some support from Fed Chair Jerome Powell’s comments on Tuesday, warning against market hopes of a steep monetary easing cycle. Powell reiterated that the Fed is in a challenging position trying to navigate higher inflationary risks and a softening labor market, and that the bank is likely to move slowly on rate cuts.
Technical Analysis: Gold seems ripe for a bearish correction
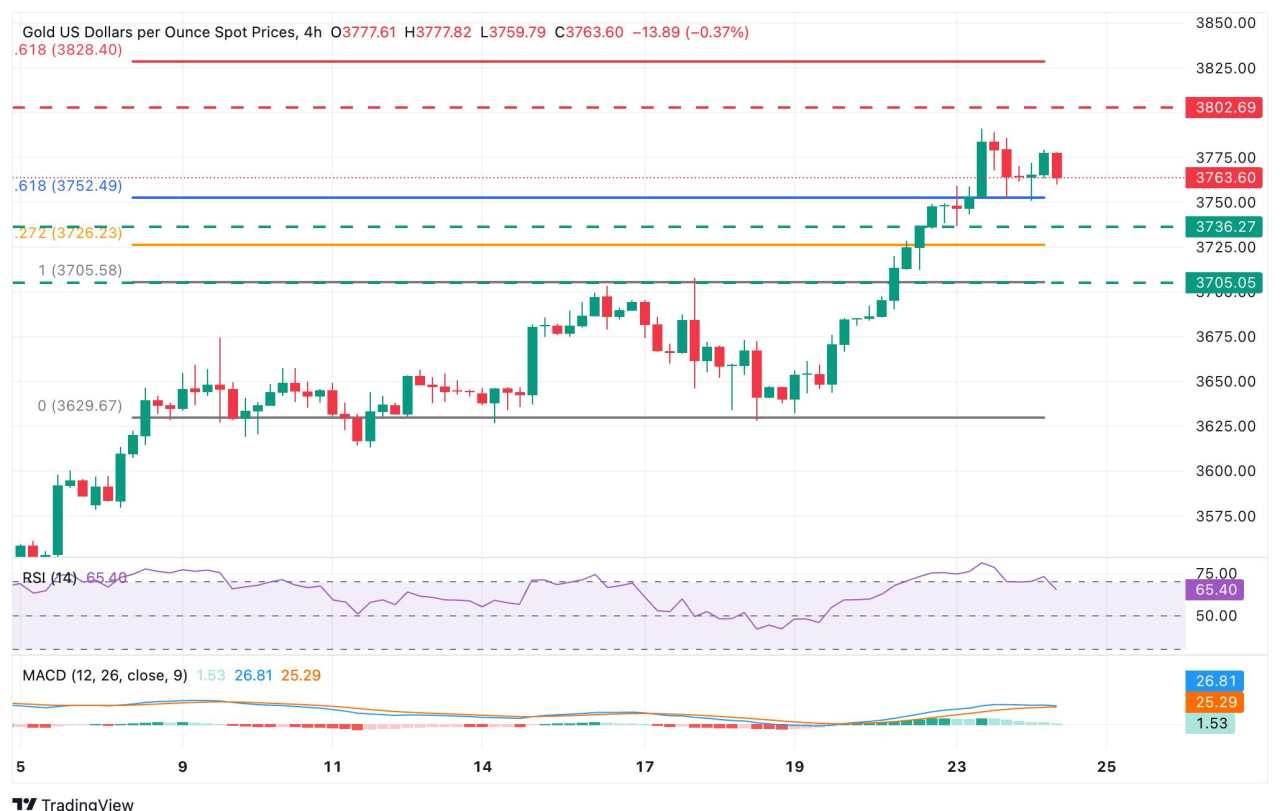
From a technical perspective, Gold seems ready for a healthy correction, following a nearly 15% rally from mid-August lows. The 4-hour RSI has retreated from overbought levels, and the MACD is crossing below the signal line, suggesting the possibility of a deeper pullback.
Bears, however, will have to push the pair below the intra-day low, at $3,750, and Tuesday’s low, at $3,736. Further down the previous all-time high, in the area of $3,700, would come into focus.
On the upside, Tuesday’s high, at $3,790, and the psychological level at $3,800 are likely to test any potential bullish reaction. Beyond here, the 261.8% Fibonacci retracement of the mid-September pullback, at $3,828, emerges as the next target.
US Dollar Price Today
The table below shows the percentage change of US Dollar (USD) against listed major currencies today. US Dollar was the strongest against the Euro.
| USD | EUR | GBP | JPY | CAD | AUD | NZD | CHF | |
|---|---|---|---|---|---|---|---|---|
| USD | 0.54% | 0.41% | 0.52% | 0.28% | -0.15% | 0.36% | 0.46% | |
| EUR | -0.54% | -0.13% | 0.00% | -0.26% | -0.68% | -0.18% | -0.08% | |
| GBP | -0.41% | 0.13% | 0.08% | -0.13% | -0.49% | -0.06% | 0.01% | |
| JPY | -0.52% | 0.00% | -0.08% | -0.26% | -0.67% | -0.24% | -0.09% | |
| CAD | -0.28% | 0.26% | 0.13% | 0.26% | -0.40% | 0.07% | 0.19% | |
| AUD | 0.15% | 0.68% | 0.49% | 0.67% | 0.40% | 0.51% | 0.62% | |
| NZD | -0.36% | 0.18% | 0.06% | 0.24% | -0.07% | -0.51% | 0.13% | |
| CHF | -0.46% | 0.08% | -0.01% | 0.09% | -0.19% | -0.62% | -0.13% |
The heat map shows percentage changes of major currencies against each other. The base currency is picked from the left column, while the quote currency is picked from the top row. For example, if you pick the US Dollar from the left column and move along the horizontal line to the Japanese Yen, the percentage change displayed in the box will represent USD (base)/JPY (quote).
from
作者:Guillermo Alcala,文章来源FXStreet,版权归原作者所有,如有侵权请联系本人删除。
风险提示:本文所述仅代表作者个人观点,不代表 Followme 的官方立场。Followme 不对内容的准确性、完整性或可靠性作出任何保证,对于基于该内容所采取的任何行为,不承担任何责任,除非另有书面明确说明。


加载失败()