High-volume resistance levels typically require multiple attempts before being violated.
Fuel for the recent rally may be largely exhausted.
Some index charts saw improvements violated resistance levels and near-term downtrend lines in Monday's trading action. However, they are very near high-volume resistance levels that may be difficult to overcome.
Meanwhile, the McClellan Oscillators are at levels that suggest the recent rally may run out of steam. What's more, valuation continues to appear extended.
Let's check of the charts, those resistance levels and the data.
On the Charts
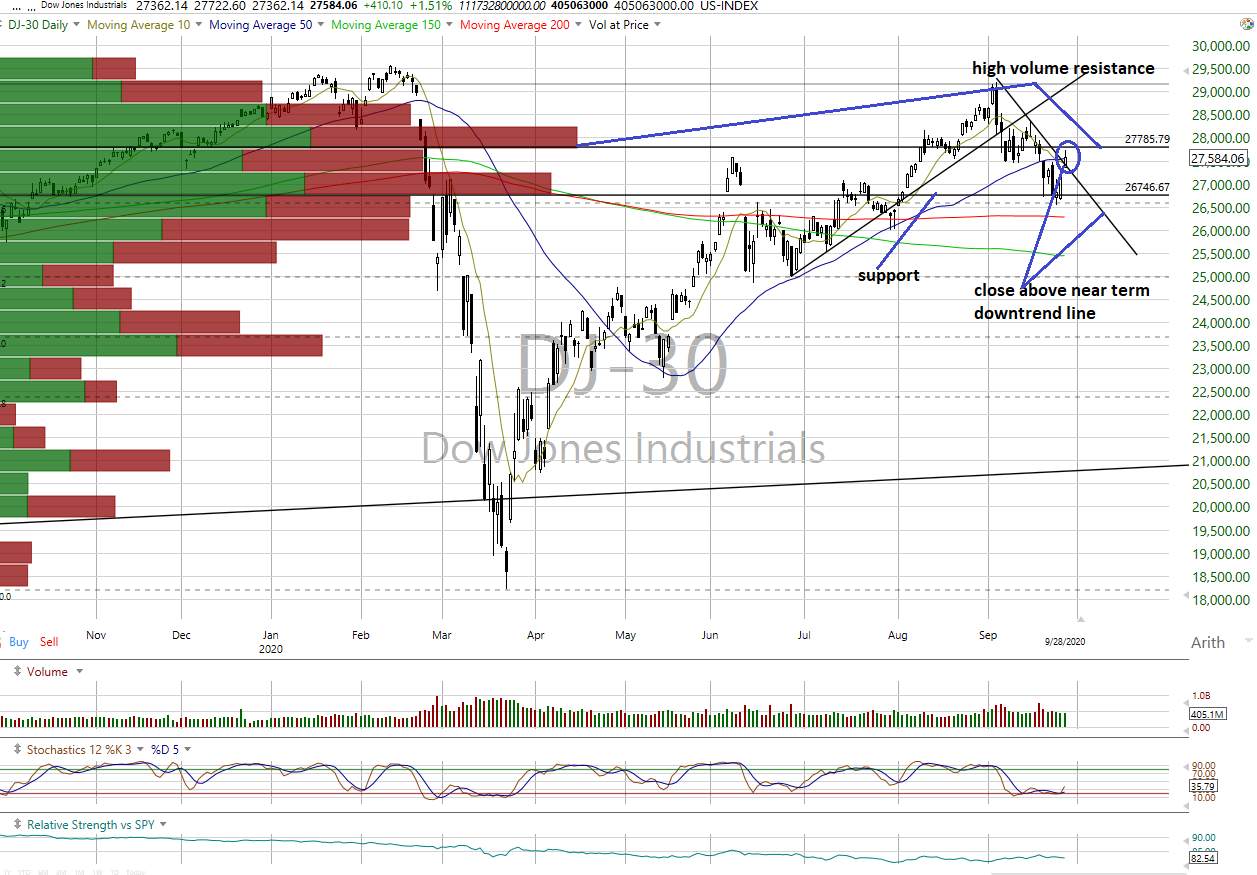
Source: Worden
All the equity indices closed higher Monday with positive internals on the NYSE and Nasdaq on lighter trading volumes.
The S&P 500, Nasdaq Composite, Nasdaq 100, Dow Jones Transports and Value Line Arithmetic Index closed above resistance while DJIA (see above) closed above its near-term downtrend line, turning its trend to neutral.
However, the DJIA, S&P 500, S&P MidCap 400 and Value Line index are now quite close to high-volume resistance levels that typically require multiple attempts before being violated. We suspect they may be meaningful roadblocks.
Regarding trend, the Dow Jones Transports is positive with the S&P, Nasdaq Composite, Nasdaq 100 and DJIA neutral as the rest remain negative.
Cumulative breadth turned neutral on the All Exchange and NYSE but is still negative on the Nasdaq. All have made lower highs and lower lows from their August peaks.
Index Support/Resistance Levels
S&P 500: 3,233/3,382
DJIA: 26,747/27,786
Nasdaq Composite: 10,534/11,167
Nasdaq 100: 10,756/11,442
Dow Jones Transports: 11,086/11,546
S&P MidCap 400: 1,780/1,899
Russell 2000: 1,450/1,500
Value Line Arithmetic Index: 5,975/6,388
Digging in on the Data
The one-day McClellan Overbought/Oversold Oscillators are neutral (All Exchange: +8.9 NYSE: +4.01 Nasdaq: +13.86). They suggest last week's deeply oversold conditions that implied a pause/bounce for the markets have been largely resolved.
The Open Insider Buy/Sell Ratio is neutral at 61.1 while the detrended Rydex Ratio (contrary indicator) remains neutral at +0.51 as the leveraged ETF traders slightly increased their leveraged long exposure.
This week's Investors Intelligence Bear/Bull Ratio (contrary indicator) saw a slight rise in bearish sentiment to 19.4/51.5. There is potential for the beginning of an important sentiment shift to the bearish camp.
The counterintuitive percentage of S&P 500 issues trading above their 50-day moving averages is neutral at 43.4%.
Valuation
The valuation gap remains extended, with the S&P 500 trading at a P/E multiple of 22.9x consensus forward 12-month earnings estimates from Bloomberg of $146.56 per share, while the "rule of 20" finds fair value at 19.3x.
The S&P's forward earnings yield is 4.37% with the 10-year Treasury yield at 0.66%.
Near-Term Outlook
Monday's action may have been the completion of an oversold bounce and rally to high-volume resistance levels. As little else has changed regarding sentiment and valuation, we believe there is a reasonable probability this rally to resistance may fail. We remain near-term "negative" in our outlook.
Reprinted from yahoofinance, the copyright all reserved by the original author.
#investment##StockMarket##S&P500##DOW#
风险提示:本文所述仅代表作者个人观点,不代表 Followme 的官方立场。Followme 不对内容的准确性、完整性或可靠性作出任何保证,对于基于该内容所采取的任何行为,不承担任何责任,除非另有书面明确说明。


暂无评论,立马抢沙发