Another good tool to combine with the Fibonacci retracement tool is trend line analysis.
After all, Fibonacci retracement levels work best when the market is trending, so this makes a lot of sense!
Remember that whenever a pair is in a downtrend or uptrend, traders use Fibonacci retracement levels as a way to get in on the trend.So why not look for levels where Fib levels line up right smack with the trend?
Here’s a 1-hour chart of AUD/JPY. As you can see, the price has been respecting a short-term ascending trend line over the past couple of days.
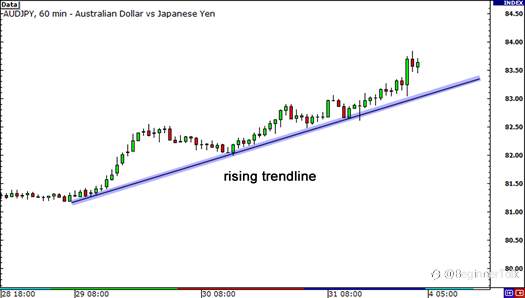
You think to yourself, “Hmm, that’s a sweet uptrend right there. I wanna buy AUD/JPY, even if it’s just for a short-term trade. I think I’ll buy once the pair hits the trend line again.”
Before you do that though, why don’t you reach for your forex toolbox and get that Fibonacci retracement tool out? Let’s see if we can get a more exact entry price.
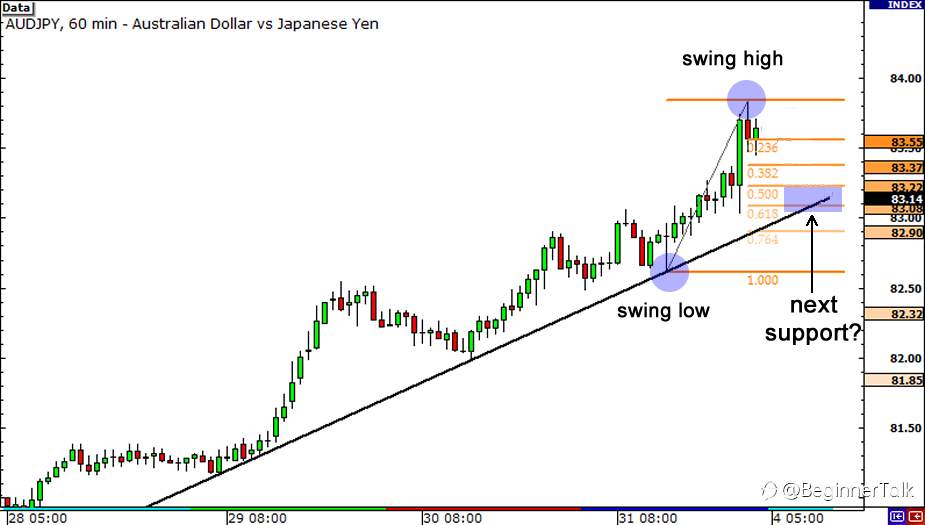
Here we plotted the Fibonacci retracement levels by using the Swing low at 82.61 and the Swing High at 83.84.
Notice how the 50.0% and 61.8% Fib levels are intersected by the rising trend line.
Could these levels serve as potential support levels? There’s only one way to find out!
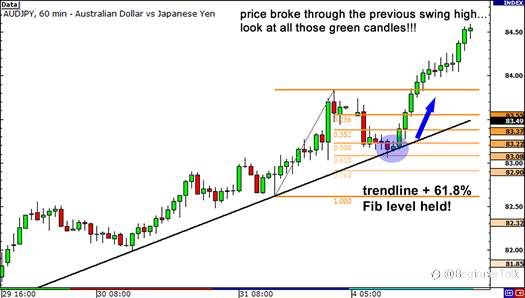
Guess what? The 61.8% Fibonacci retracement level held, as price bounced there before heading back up. If you had set some orders at that level, you would have had a perfect entry!
A couple of hours after touching the trend line, price zoomed up like Astro Boy bursting through the Swing High.
Aren’t you glad you’ve got this in your trading toolbox now?
As you can see, it does pay to make use of the Fibonacci retracement tool, even if you’re planning to enter on a retest of the trend line.
The combination of both a diagonal and a horizontal support or resistance level could mean that other traders are eying those levels as well.Take note though, as with other drawing tools, drawing trend lines can also get pretty subjective.
You don’t know exactly how other traders are drawing them, but you can count on one thing – that there’s a trend!
If you see that an uptrend is developing, you should be looking for ways to go long to give you a better chance of a profitable trade.
You can use the Fibonacci retracement tool to help you find potential entry points.
Reprinted from Babypips,the copyright all reserved by the original author.
风险提示:本文所述仅代表作者个人观点,不代表 Followme 的官方立场。Followme 不对内容的准确性、完整性或可靠性作出任何保证,对于基于该内容所采取的任何行为,不承担任何责任,除非另有书面明确说明。


加载失败()