
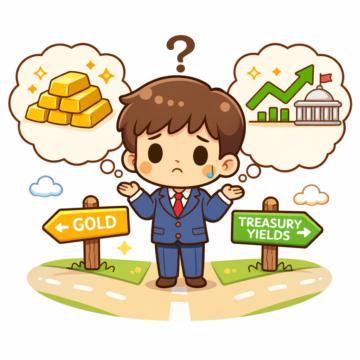
Why Gold’s “Safe-Haven” Status Isn’t Always Safe
Partner Center With war breaking out in the Middle East and an energy crisis ongoing, global economic uncertainty has been through the roof these days. So why has gold been crashing? Gold hit an all-time high of $5,589 in January 2026, then proceeded to fall about 22% below $4,400 by late March. Tha
The 48-Hour Countdown: What the Iran Escalation Means for Your Pips
Partner Center If you were hoping for a quiet start to the trading week, you might want to brew an extra pot of coffee. On Friday, March 20, President Trump posted that the U.S. was “getting very close” to winding down military operations in Iran. Oil eased, and markets exhaled. Then, less than 24 h

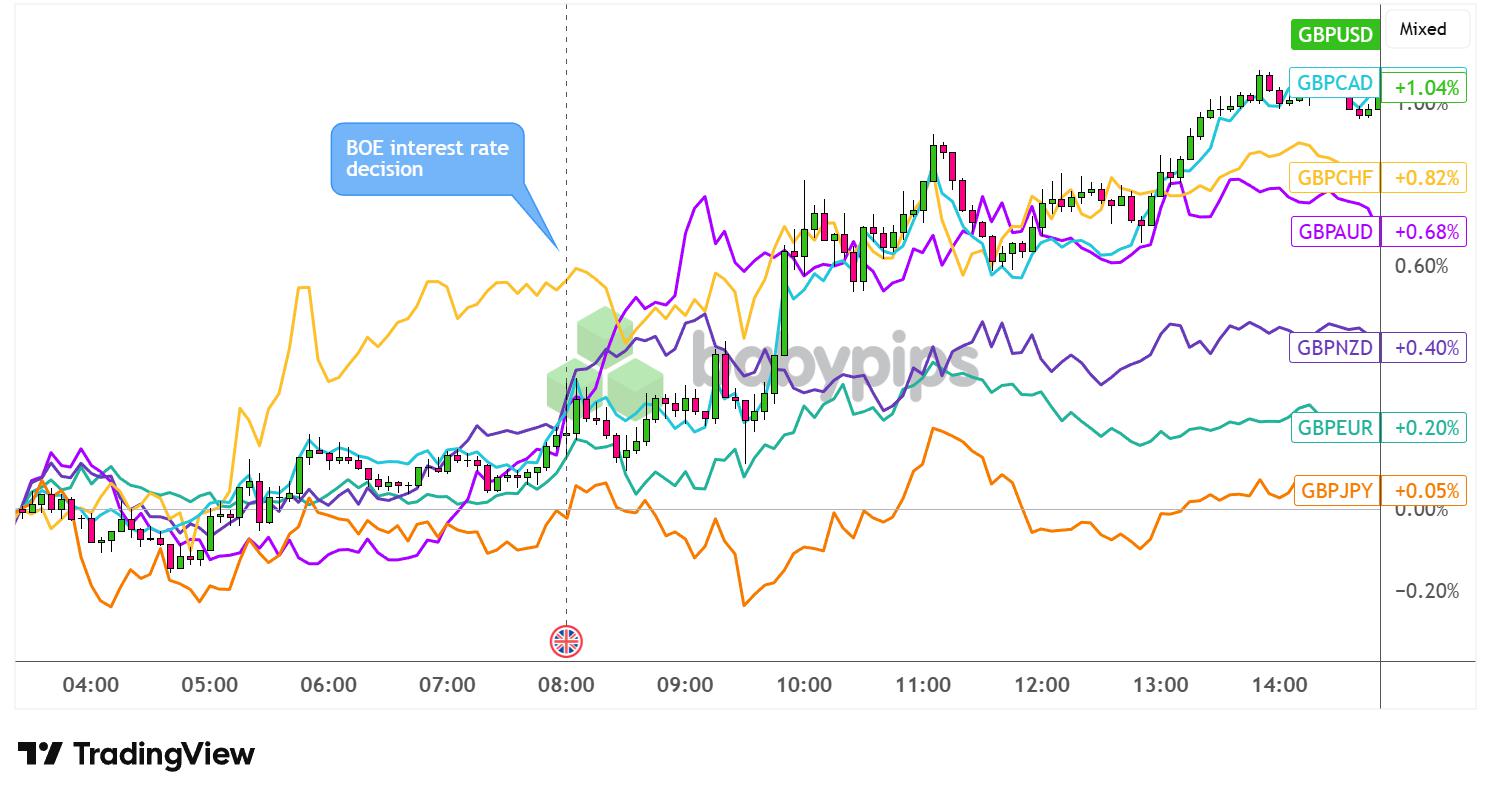
BOE Announced “Hawkish Hold” As Inflation Risks Rose on US-Iran War
Partner Center The Bank of England’s Monetary Policy Committee voted unanimously to keep Bank Rate on hold at 3.75% at its March 2026 meeting, as a sharp spike in global energy prices triggered by conflict in the Middle East forced policymakers to shift their focus back to inflation risks. Markets h
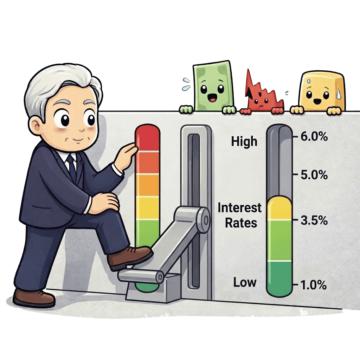
The Fed Didn’t Move Rates. Markets Moved Anyway. Here’s Why.
Partner Center You might expect that when the Federal Reserve leaves interest rates exactly where they were, nothing much happens. Same rates. Same policy. No drama. But this week, the Fed held rates unchanged — and stocks still fell to session lows, Treasury yields jumped, and the U.S. Dollar Index
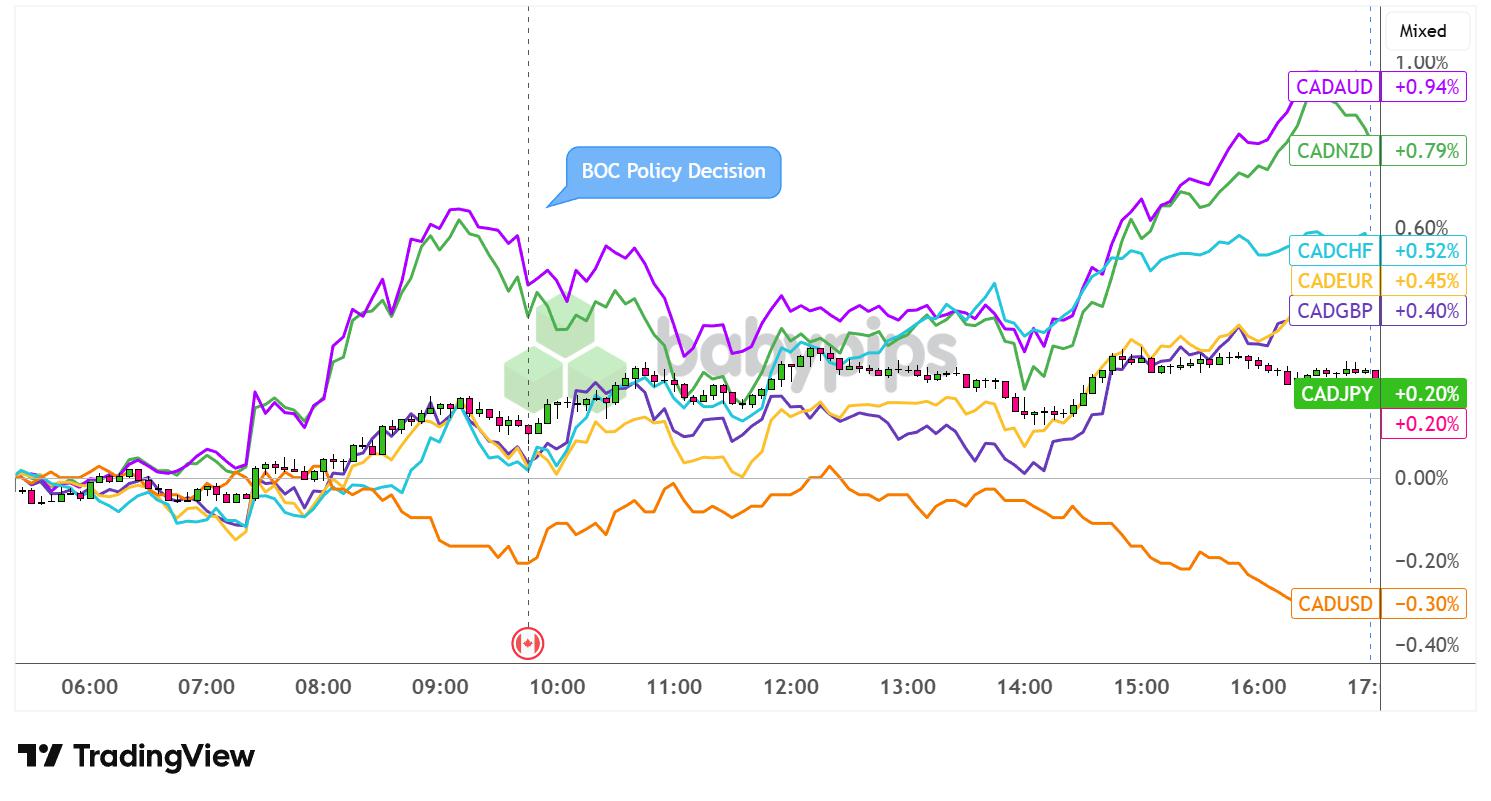
BOC Holds Rates at 2.25% As US-Iran War and CUSMA Cloud Outlook
Partner Center The Bank of Canada kept its policy rate unchanged at 2.25% for the fifth consecutive meeting, citing a deteriorating growth outlook and rising inflation risks stemming from the conflict in the Middle East. The decision was widely in line with market expectations heading into the annou
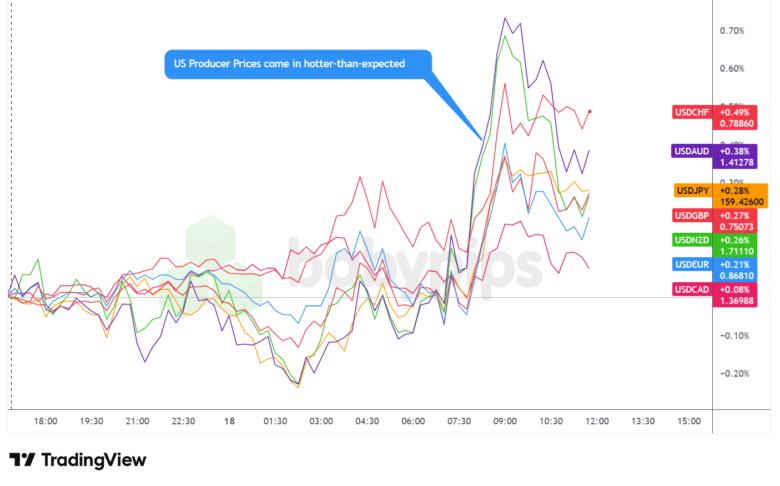
U.S. Wholesale Prices Jump 0.7% In February, Above Forecasts
Partner Center The Producer Price Index for final demand increased 0.7% in February, above the 0.5% consensus forecast, according to data released today by the U.S. Bureau of Labor Statistics. On an unadjusted basis, the index for final demand rose 3.4% for the 12 months ended in February, the large
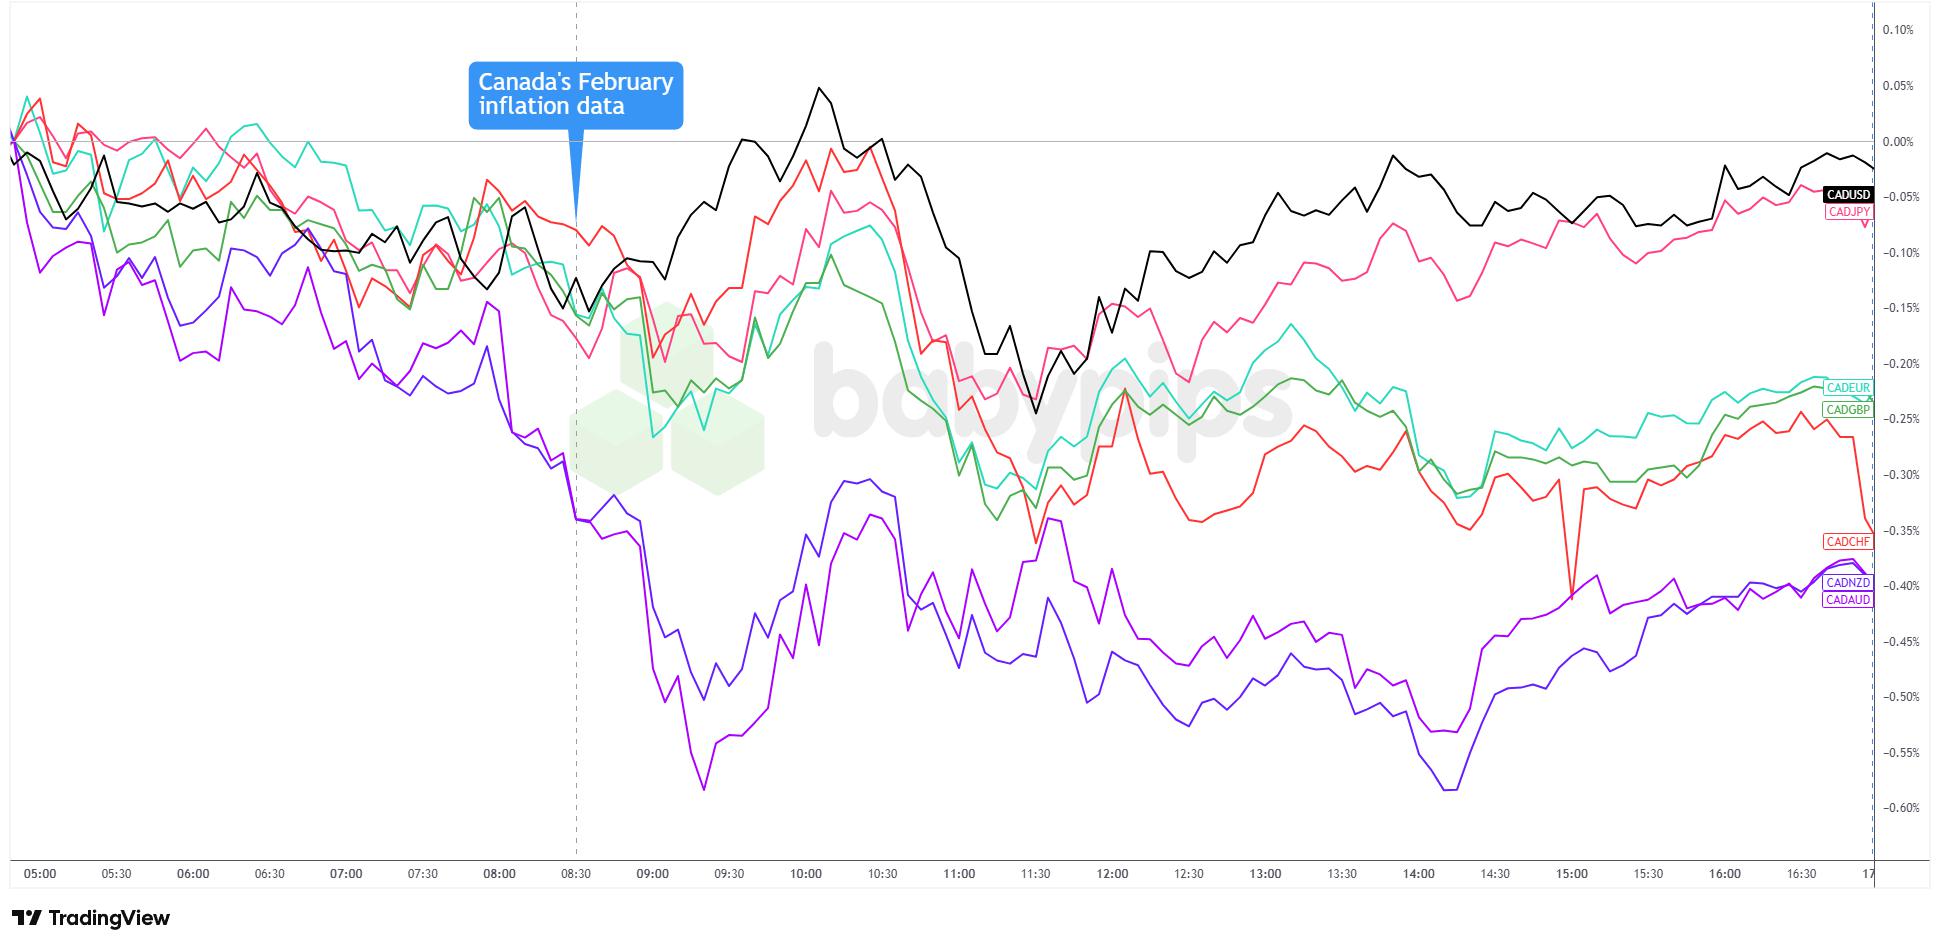
Why Canada’s “Mission Accomplished” Inflation Print Doesn’t Add Up
Partner Center Canada’s latest headline Consumer Price Index (CPI) dropped to 1.8% in February, landing a couple of notches below the Bank of Canada’s 2% target for the first time in years. Mission accomplished, right? Not quite. Behind that tidy number is a cocktail of tax distortions, stale data,
RBA Hikes to 4.10%, but AUD Drops as Narrow Vote Raises Doubts About Further Rate Hikes
Partner Center The Reserve Bank of Australia (RBA) raised its cash rate by 25 basis points to 4.10% at its March meeting, delivering a second consecutive rate hike as stubbornly high inflation and rising energy costs from the Middle East conflict tilted risks further to the upside. The decision pass

The “Zero Payout Denial” Movement: A New Standard for Prop Firms Ahead?
Partner Center If you’ve spent any time in the prop firm world, you’ve probably heard a version of this story: trader grinds through a grueling evaluation, passes with flying colors, requests their hard-earned payout — and then watches the goalposts quietly shuffle. Suddenly there’s a “risk review,”

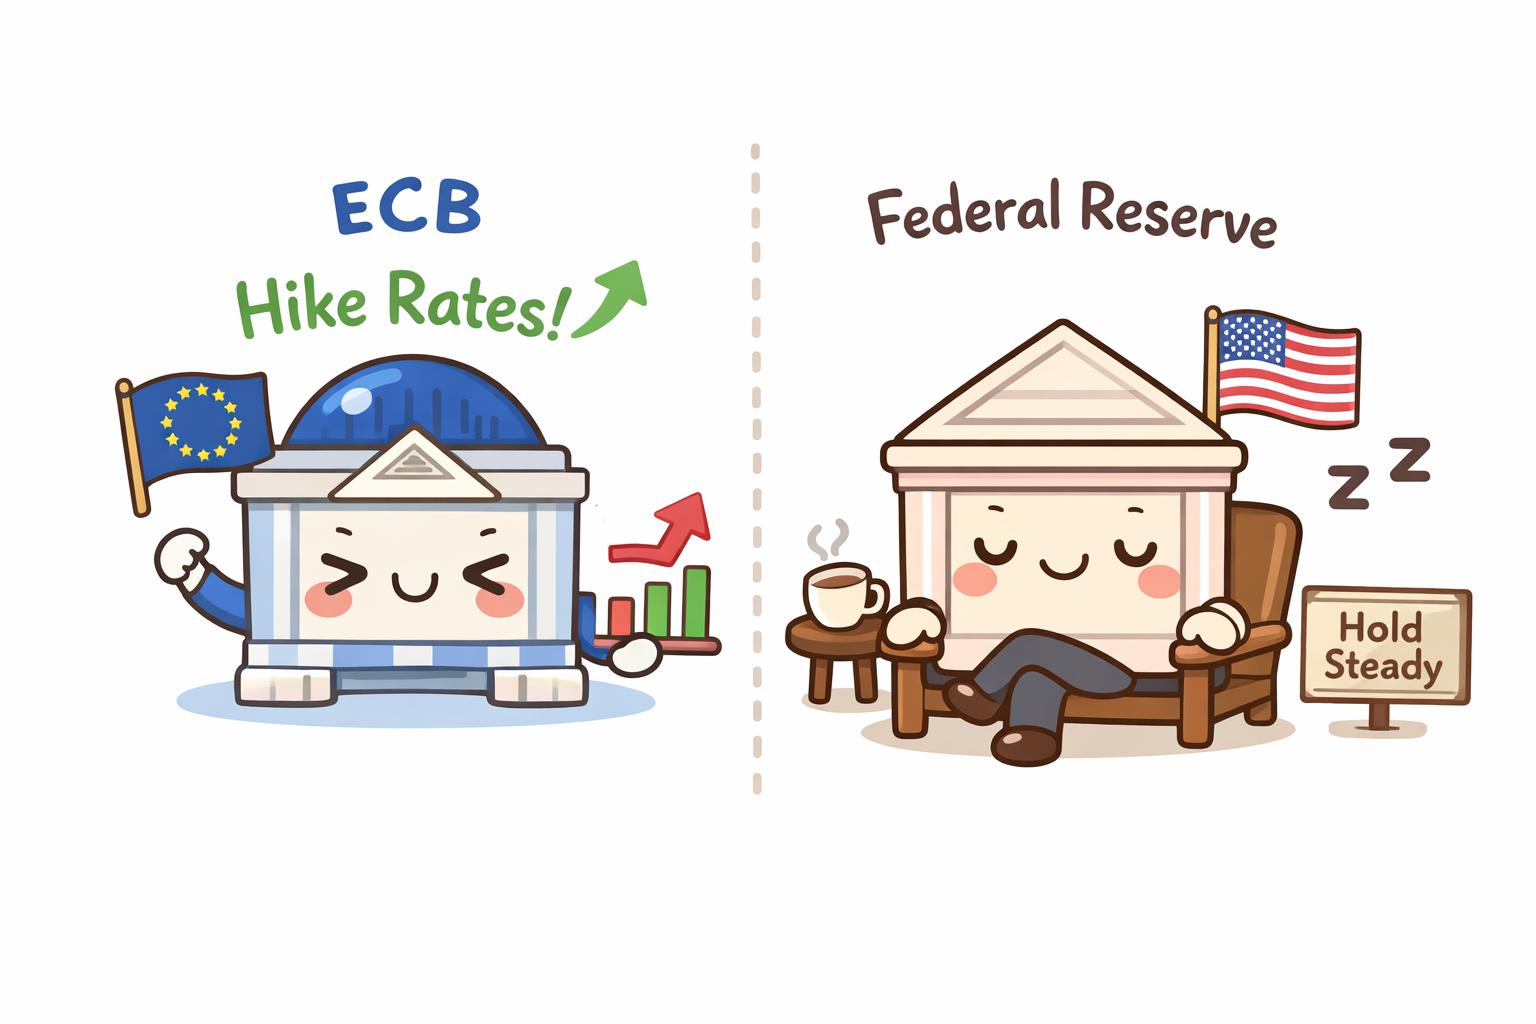
Why the ECB May Tighten While the Fed Stays Stuck — And What It Means for EUR/USD
Partner Center If you’ve heard about “policy divergence” in forex, you probably learned a simple rule: when one central bank raises rates while another holds steady, the currency of the hiking bank tends to appreciate. It’s one of the most reliable forces in currency markets. But right now, that rul
Why Tariff Fears Are Driving a New U.S. Dollar Rally
Partner Center In case you were too busy cheering Bam Adebayo beating Kobe Bryant’s record for the second-highest scoring game in NBA history, you should know that the U.S. dollar is climbing while almost everything else is struggling. Behind the move are two powerful forces working at the same time
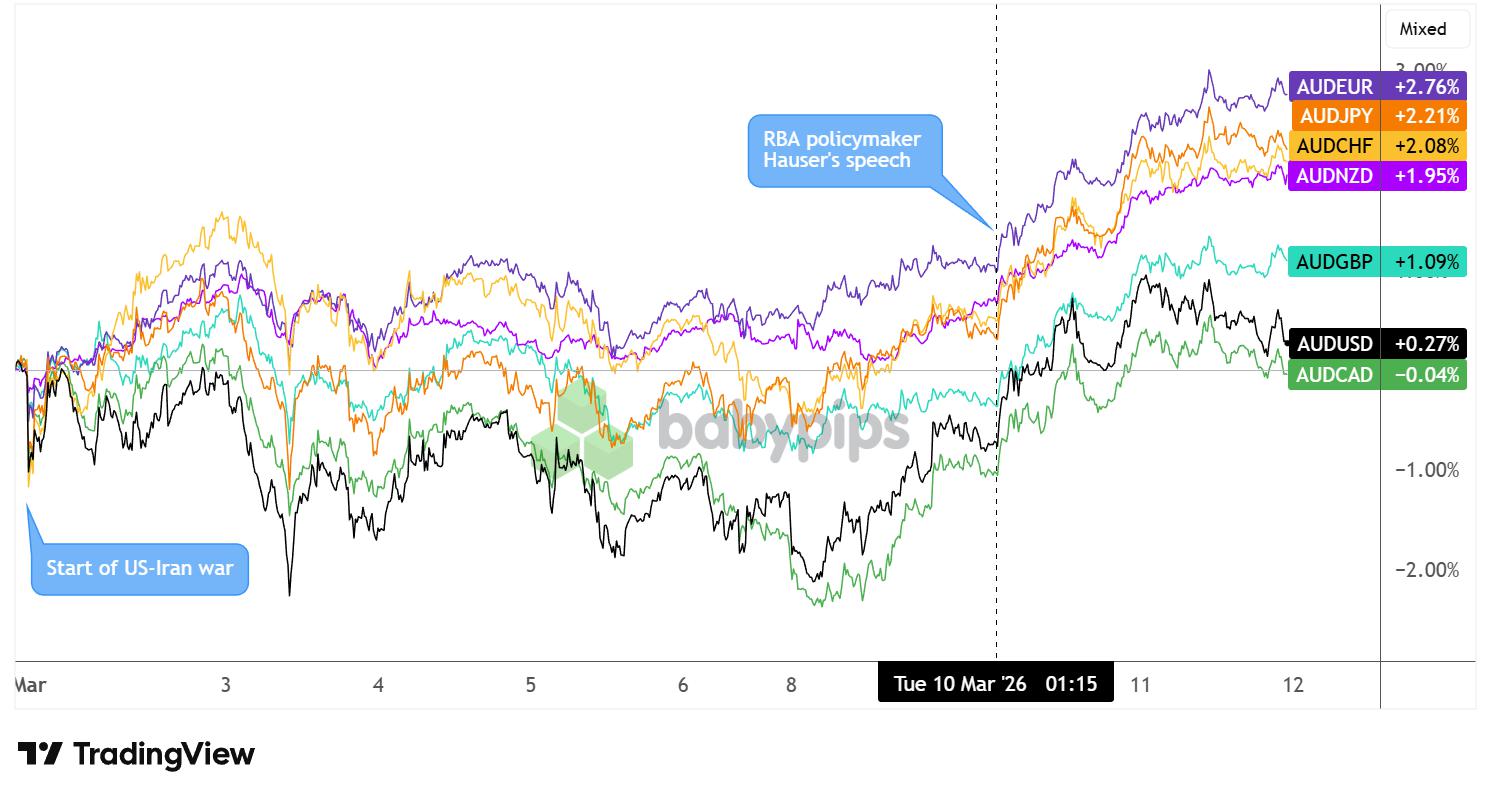
While the World Panics, the Aussie Is Rallying. What’s Up With That?!
Partner Center If you’ve been watching currency markets this week and wondering why the Australian dollar is suddenly the hottest currency on the board, you’re not alone. AUD has climbed to its highest level since June 2022, and it’s up more than 13% over the past 12 months. So, what’s driving the m
U.S. February CPI In Line With Forecasts; USD Firms as Iran War Keeps Inflation Fears Alive
Partner Center The U.S. Consumer Price Index rose 0.3% month-over-month in February 2026, meeting consensus expectations and holding the annual inflation rate steady at 2.4%, according to data released Wednesday by the Bureau of Labor Statistics (BLS). However, the broadly in-line report was immedia
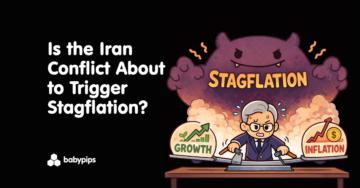
The Ghost of the 1970s: Why the Iran Conflict Puts “Stagflation” Back on the Menu
Partner Center Just a few weeks ago, U.S. inflation was looking like a problem nearly solved. The U.S. Consumer Price Index came in at 2.4% in January, its lowest reading in years, and traders were confidently pricing in Fed rate cuts by June. The finish line was in sight. Then, on February 28, ̶t̶h
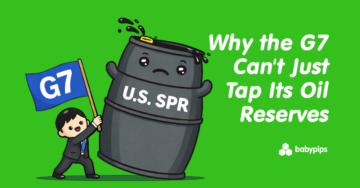
The G7’s Oil Emergency Dilemma: Why Tapping Into Reserves Isn’t So Simple
Partner Center Earlier this week we’ve seen a major whipsaw in crude oil, as WTI spiked above $119 per barrel then crashed right back below $100 in a single trading session. This kind of 25% intraday swing doesn’t happen without a serious reason. And the reason still revolves around the Strait of Ho
正在加载中...
