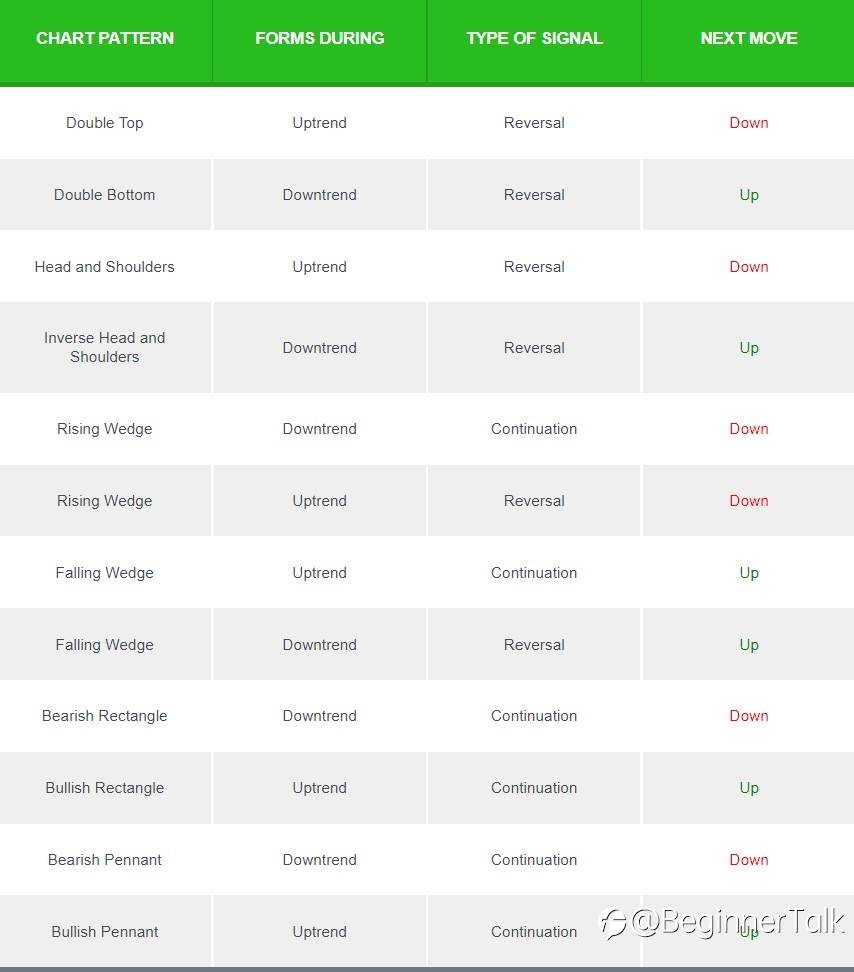
Like we promised, here’s a neat little cheat sheet to help you remember all those chart patterns and what they are signaling.
We’ve listed the basic classic chart patterns, when they are formed, what type of signal they give, and what the next likely price move may be.
Check it out!
You also might want to add this page to your bookmarks in case you need to double-check those chart patterns’ signals before you risk your hard-earned cash on a trade.
You never know when you’re gonna need to cheat, hah! Bookmark this thing yo!
And as you probably noticed, we didn’t include the triangle formations (symmetrical, ascending, and descending) in this cheat sheet.
That’s because these chart patterns can form either in an uptrend or downtrend, and can signal either a trend continuation or reversal.
Confusing I know, but that’s where practice and experience come in!
As we mentioned, it’s tough to tell where the price will break out or reverse.
So what’s important is that you prepare well and have your entry/exit orders ready so that you can be part of the action either way!
Reprinted from Babypips,the copyright all reserved by the original author.
风险提示:本文所述仅代表作者个人观点,不代表 Followme 的官方立场。Followme 不对内容的准确性、完整性或可靠性作出任何保证,对于基于该内容所采取的任何行为,不承担任何责任,除非另有书面明确说明。

暂无评论,立马抢沙发