Ralph Nelson Elliott developed the Elliott Wave Theory in the 1930s.
Elliott believed that stock markets, generally thought to behave in a somewhat random and chaotic manner, in fact, traded in repetitive patterns.
In this article, we'll take a look at the history behind Elliott Wave Theory and how it is applied to trading.
KEY TAKEAWAYS
- The Elliott Wave Theory is a form of technical analysis that looks for recurrent long-term price patterns related to persistent changes in investor sentiment and psychology.
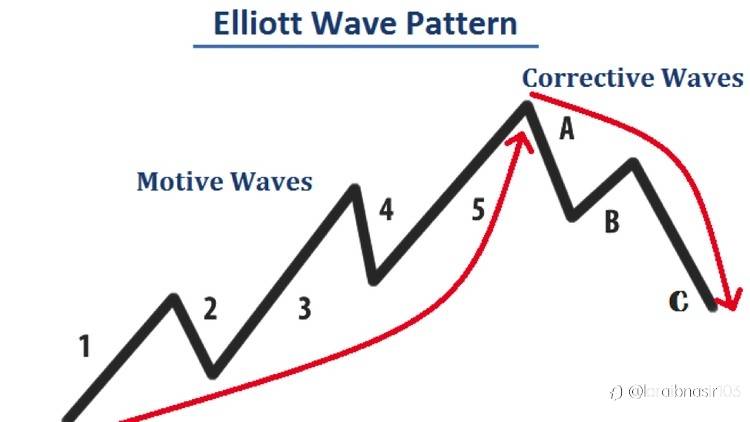
- The theory identifies impulse waves that set up a pattern and corrective waves that oppose the larger trend.
- Each set of waves is nested within a larger set of waves that adhere to the same impulse or corrective pattern, which is described as a fractal approach to investing.
Waves
TABLE OF CONTENTS
- Waves
- Predictions Based on Wave Patterns
- Elliott Wave Theory Interpretation
- Wave Degrees
- Elliott Wave Theory's Popularity
- The Bottom Line
Ralph Nelson Elliott developed the Elliott Wave Theory in the 1930s.1 Elliott believed that stock markets, generally thought to behave in a somewhat random and chaotic manner, in fact, traded in repetitive patterns.
In this article, we'll take a look at the history behind Elliott Wave Theory and how it is applied to trading.
KEY TAKEAWAYS
- The Elliott Wave Theory is a form of technical analysis that looks for recurrent long-term price patterns related to persistent changes in investor sentiment and psychology.
- The theory identifies impulse waves that set up a pattern and corrective waves that oppose the larger trend.
- Each set of waves is nested within a larger set of waves that adhere to the same impulse or corrective pattern, which is described as a fractal approach to investing.
Waves
Elliott proposed that financial price trends result from investors' predominant psychology. He found that swings in mass psychology always showed up in the same recurring fractal patterns, or "waves," in financial markets.
Elliott's theory somewhat resembles the Dow theory in that both recognize that stock prices move in waves. Because Elliott additionally recognized the "fractal" nature of markets, however, he was able to break down and analyze them in much greater detail. Fractals are mathematical structures, which on an ever-smaller scale infinitely repeat themselves.
Elliott discovered stock index price patterns were structured in the same way. He then began to look at how these repeating patterns could be used as predictive indicators of future market moves.
Market Predictions Based on Wave Patterns
Elliott made detailed stock market predictions based on reliable characteristics he discovered in the wave patterns. An impulse wave, which net travels in the same direction as the larger trend, always shows five waves in its pattern. A corrective wave, on the other hand, net travels in the opposite direction of the main trend. On a smaller scale, within each of the impulsive waves, five waves can again be found.
This next pattern repeats itself ad infinitum at ever-smaller scales. Elliott uncovered this fractal structure in financial markets in the 1930s, but only decades later would scientists recognize fractals and demonstrate them mathematically.
In the financial markets, we know that "what goes up, must come down," as a price movement up or down is always followed by a contrary movement. Price action is divided into trends and corrections. Trends show the main direction of prices, while corrections move against the trend.
风险提示:本文所述仅代表作者个人观点,不代表 Followme 的官方立场。Followme 不对内容的准确性、完整性或可靠性作出任何保证,对于基于该内容所采取的任何行为,不承担任何责任,除非另有书面明确说明。

暂无评论,立马抢沙发