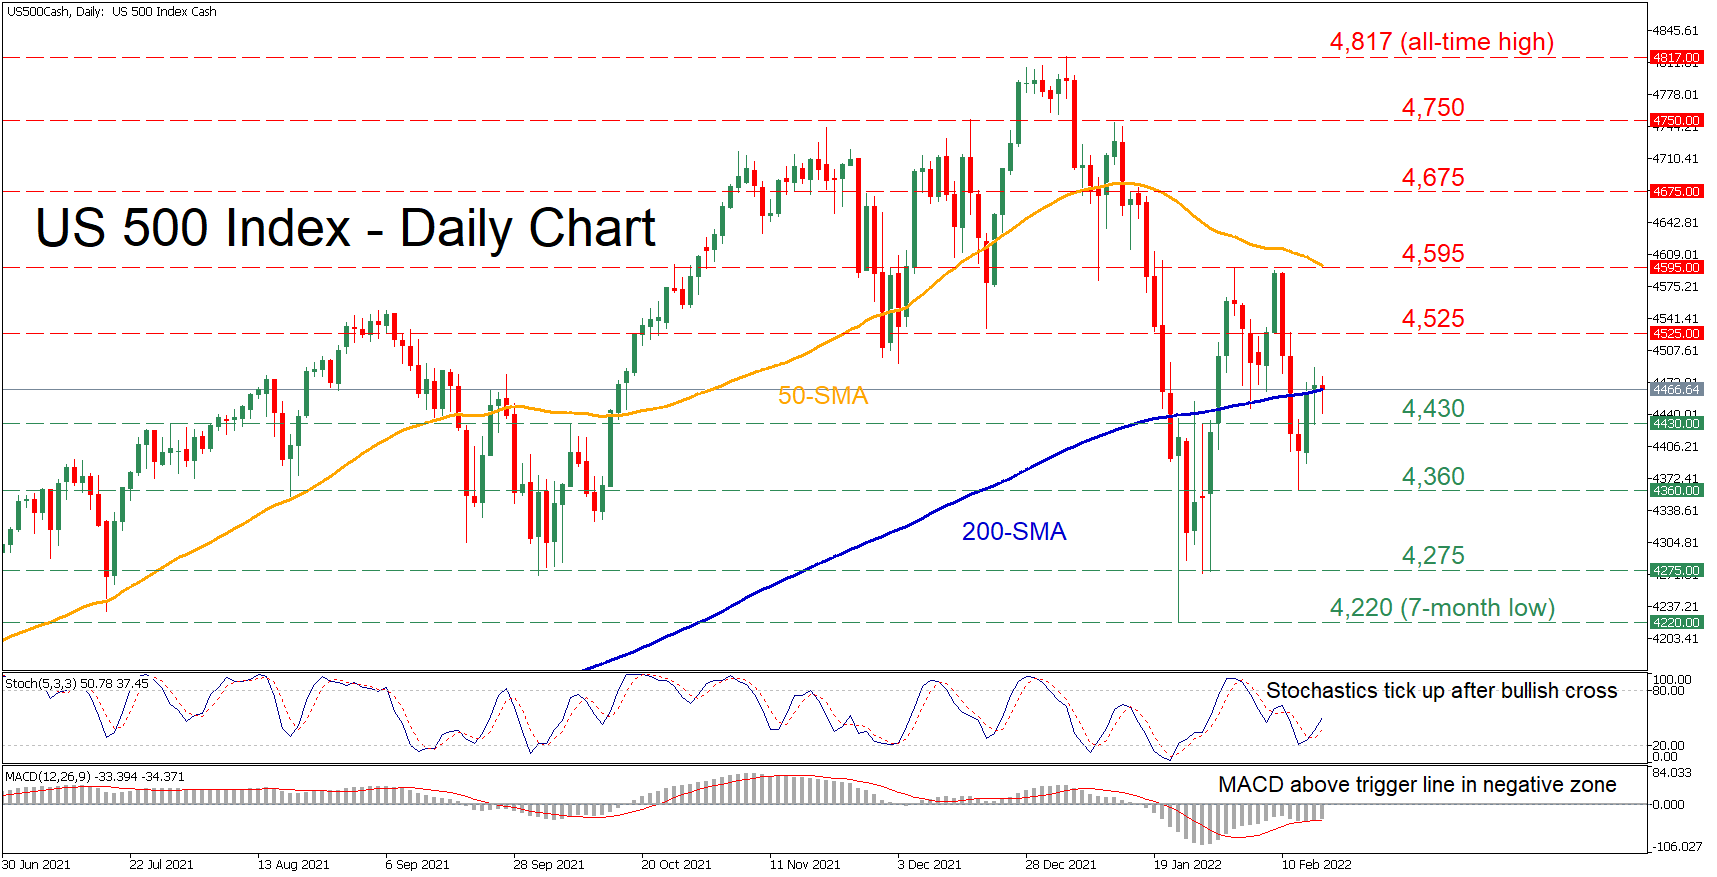
The US 500 stock index (cash) has been in a recovery mode since its short-term decline halted at the seven-month low of 4,220. Although the index’s upside move experienced a minor pullback, the near-term picture seems to be improving and the price is currently pivoting near its 200-day simple moving average (SMA).
The momentum indicators further confirm that bullish forces have re-emerged. The stochastic oscillator is sloping upwards after posting a bullish cross, while the MACD histogram is found above its red signal line but beneath zero.
Should the positive momentum strengthen, and the price profoundly jumps above its 200-SMA, initial resistance could be encountered at the 4,525 barrier. If the upside pressure persists, the price may climb towards the 4,595 hurdle, which overlaps with the 50-day SMA and rejected three price advances in the last month. Crossing above this region, the spotlight could turn to the 4,675 level, a violation of which would set the stage for 4,750.
Alternatively, if sellers retake control and push the index lower, the recent low of 4,430 could act as the first support region. Should the price breach this level, the bears might aim for the 4,360 obstacle. Piercing through this barricade, the price could descend towards 4,275 before it challenges the seven-month low of 4,220.
Overall, the US 500 index seems to be struggling to jump above its 200-day SMA, but immediate-term bias is improving. However, a clear break above 4,595 is needed to signal the resumption of the index’s short-term rebound.
风险提示:本文所述仅代表作者个人观点,不代表 Followme 的官方立场。Followme 不对内容的准确性、完整性或可靠性作出任何保证,对于基于该内容所采取的任何行为,不承担任何责任,除非另有书面明确说明。

暂无评论,立马抢沙发