· 阅读量 1,600
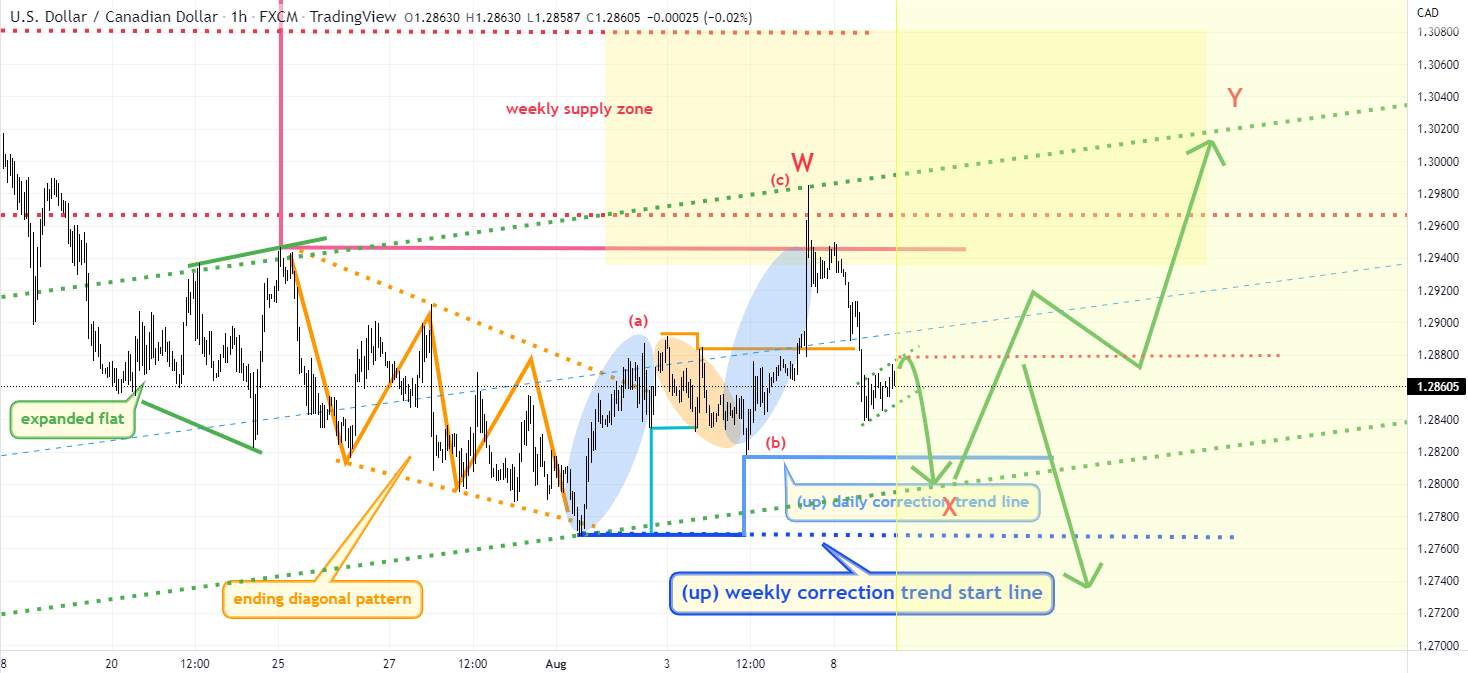
USDCAD is a daily bullish pattern , but if the daily correction trend line breaks and rebounds, there are two cases.
The first can be a daily bullish pattern with a reversal structure, with the starting line being the weekly correction trend starting line. The second can be a W-X-Y pattern of a complex structure. That is, after reaching the weekly supply zone once more, it creates a weekly correction trend line to the right of the downtrend and becomes a pattern that can fall again. If it rises strongly in the weekly supply zone , it could be followed by a daily upward wave with the first one being extended. However, if the correction start line is broken, the above two will become invalid, and it will become a daily downward wave pattern. #OPINIONLEADER#
风险提示:本文所述仅代表作者个人观点,不代表 Followme 的官方立场。Followme 不对内容的准确性、完整性或可靠性作出任何保证,对于基于该内容所采取的任何行为,不承担任何责任,除非另有书面明确说明。
喜欢的话,赞赏支持一下

暂无评论,立马抢沙发