· 阅读量 1,813
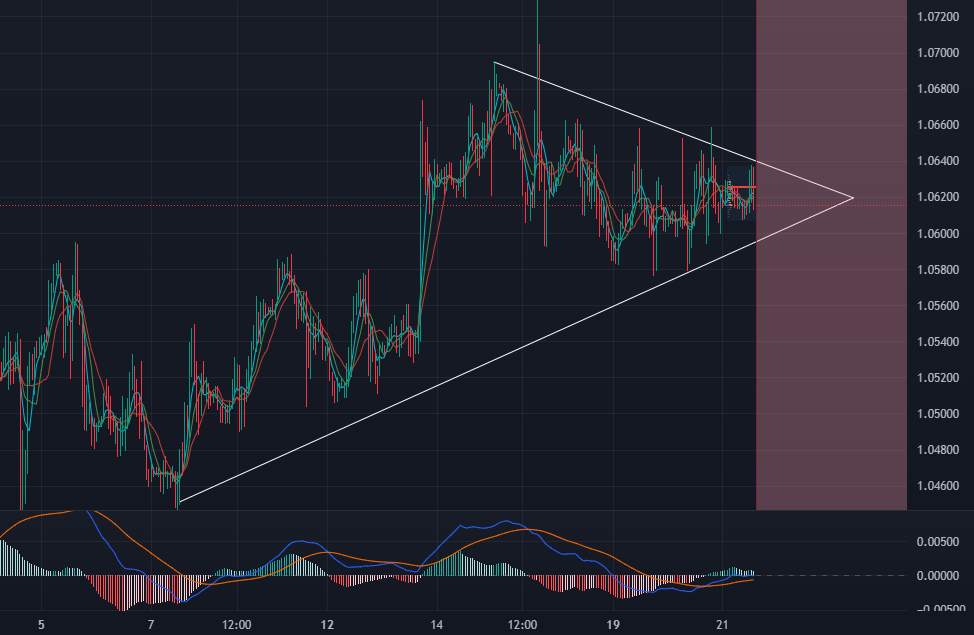
EUR vs USD created ascending triangle pattern in H1 timeframe. But we need compare it with the bigger timeframes also. In H4, EURUSD wanna break trendline and want to go downside. In Daily timeframe , it show us strong level between 1.0636 and 1.0776.
Now, what will think for further analysis? Let's research now.
Strong pattern is ascending triangle . It supports by breaking trend line in H4 also. This situation is a simple reminder for jumping up. But we should remember that EURUSD is high volatile pair and any fundamental or technical news can affect it positively or negatively.
In my opinion:
EURUSD will break trendline in H4, follow strong barrier in Daily timeframe . We can put:
SELL LIMIT at 1.0733
TARGET 1.0405
STOP LOSS 1.0805
or
SELL STOP at 1.0560
TARGET 1.0405
STOP LOSS 1.0743
These are only forecast. Do not forget to use SL in own trading. Trading without stop loss and bigger lots can cause heavy losses.
Good luck!
风险提示:本文所述仅代表作者个人观点,不代表 Followme 的官方立场。Followme 不对内容的准确性、完整性或可靠性作出任何保证,对于基于该内容所采取的任何行为,不承担任何责任,除非另有书面明确说明。
喜欢的话,赞赏支持一下

暂无评论,立马抢沙发