Royal Caribbean Cruises Ltd (NYSE: RCL), a top global cruise company, has overcome challenges and is poised for more growth. Since the 2020 crash, the stock has achieved remarkable growth, surging over +1000% and reaching new all-time highs. This impressive rally underscores its bullish momentum and resilience in overcoming past challenges. This article explores Elliott Wave analysis, revealing bullish patterns that could attract investors and traders alike.
RCL Weekly Chart
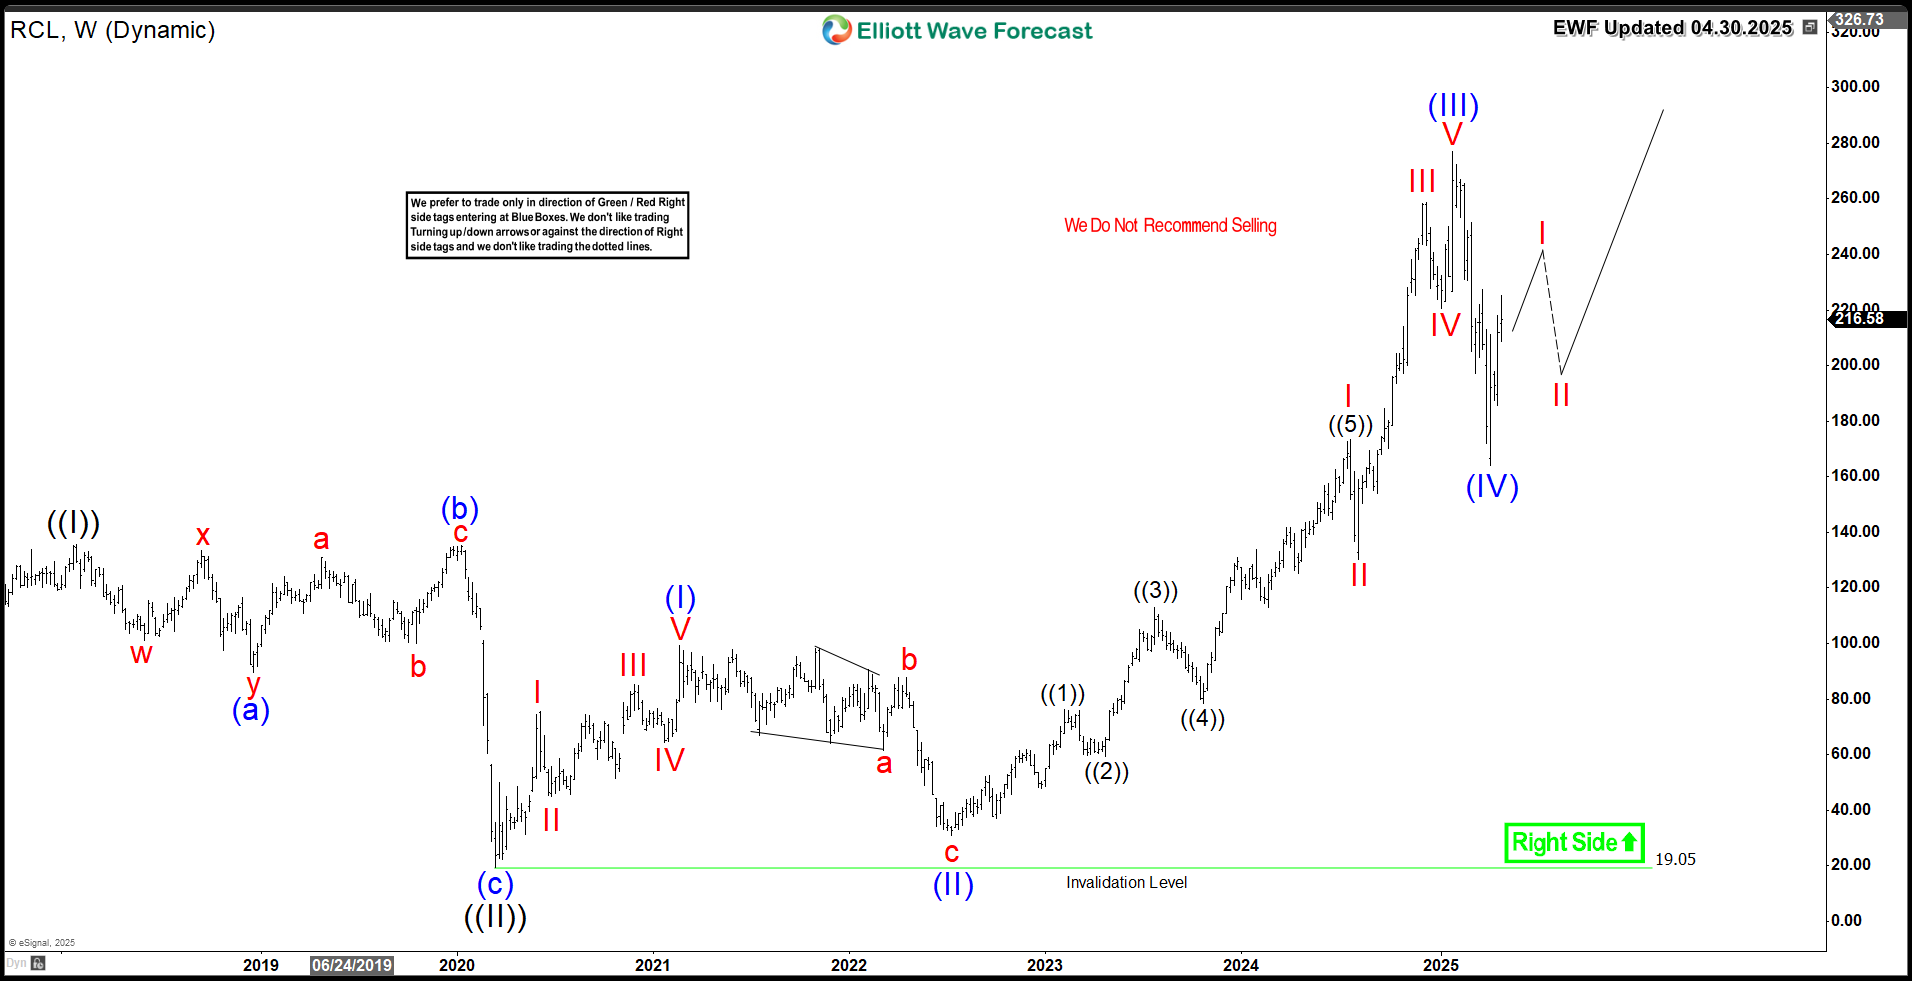
Elliott Wave Analysis
The above weekly chart of RCL shows an impulsive 3 waves move into new highs from wave ((II)) low $19. Wave (I) at $99, wave (II) at $31, wave (III) at $277 and recently it ended wave (IV) pullback at $164. Consequently, the current sequence is incomplete and it's expected to rally higher in wave (V) of ((III)) before a larger correction takes place in wave ((IV)). The next upward leg targets the Fibonacci extension range of $304 - $348. This signals continued bullish momentum in RCL's structure.
Conclusion
The bullish Grand Super Cycle for RCL is ongoing, suggesting opportunities to buy daily and weekly corrective pullbacks using our Elliott Wave strategy. The ideal approach involves purchasing after the stock completes a 3, 7, or 11 swing sequence from its peak. Leveraging our extreme Blue Box system helps pinpoint optimal entry points, ensuring clarity and accuracy in trading decisions. Explore our system to gain deeper insights into this methodology.
风险提示:以上内容仅代表作者或嘉宾的观点,不代表 FOLLOWME 的任何观点及立场,且不代表 FOLLOWME 同意其说法或描述,也不构成任何投资建议。对于访问者根据 FOLLOWME 社区提供的信息所做出的一切行为,除非另有明确的书面承诺文件,否则本社区不承担任何形式的责任。
FOLLOWME 交易社区网址: www.followme.ceo


加载失败()