Carvana Co (NYSE: CVNA) has rebounded impressively over the past 2 years after a 98% decline between 2021 and 2022. The stock recovered most of its losses, forming a strong impulsive structure that signals further upside potential. With a continuation pattern in place, CVNA appears poised to challenge new all-time highs. This article delves into Elliott Wave analysis, uncovering bullish formations that could appeal to both investors and traders.
CVNA Weekly Chart
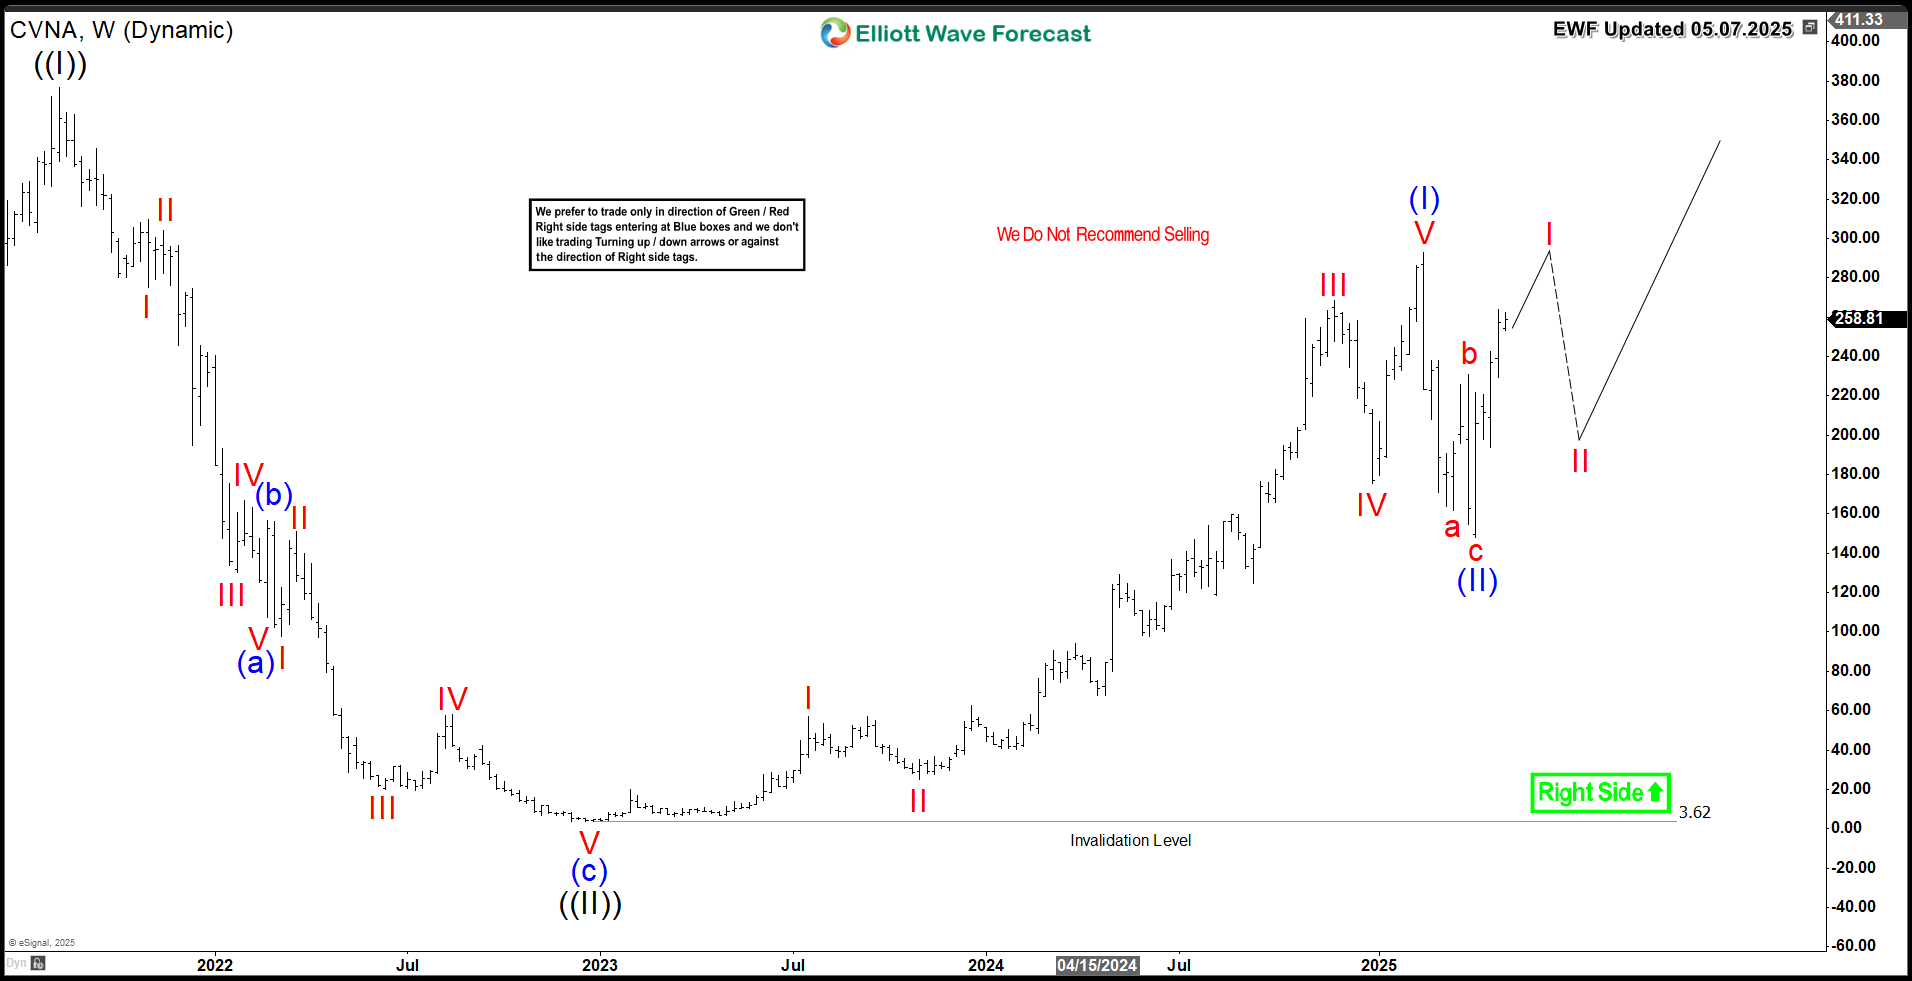
Elliott Wave Analysis
The weekly chart of CVNA illustrates an impulsive 5-wave move from the wave ((II)) low at $3.62. The stock surged 8000%, completing wave (I) at $292, followed by a 3-wave corrective pullback in wave ((II)), bottoming at $142.
Subsequently, CVNA initiated its next bullish phase in wave (III), aiming to break above the February 2025 peak to confirm its upward structure. Most importantly, if the stock establishes a bullish sequence, the next leg targets the Fibonacci extension range of $437 – $505. Consequently, this signals sustained bullish momentum toward new all-time highs.
Conclusion
The bullish Super Cycle for CVNA remains in progress, presenting opportunities to buy daily and weekly corrective pullbacks using our Elliott Wave strategy. The preferred approach is to enter positions after the stock completes a 3, 7, or 11 swing sequence from its peak. Additionally, utilizing our extreme Blue Box system refines entry points, providing clarity and precision in trading decisions. Explore our system to gain deeper insights into this methodology.
风险提示:以上内容仅代表作者或嘉宾的观点,不代表 FOLLOWME 的任何观点及立场,且不代表 FOLLOWME 同意其说法或描述,也不构成任何投资建议。对于访问者根据 FOLLOWME 社区提供的信息所做出的一切行为,除非另有明确的书面承诺文件,否则本社区不承担任何形式的责任。
FOLLOWME 交易社区网址: www.followme.ceo


加载失败()