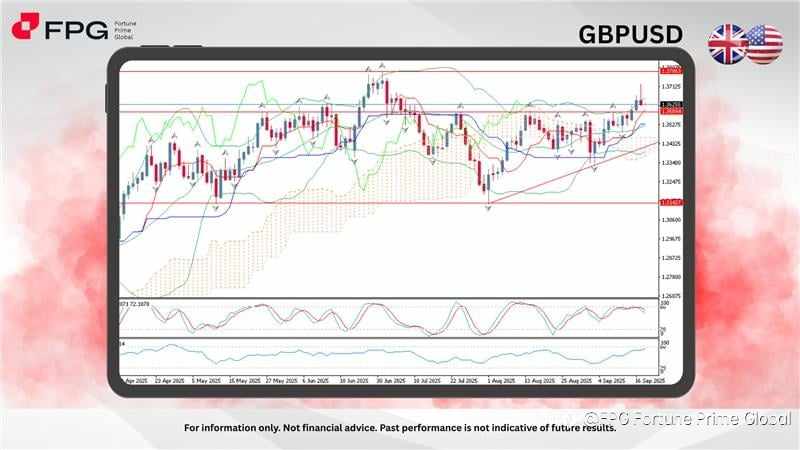
The GBPUSD daily chart shows strong bullish momentum as price has broken above the 1.3589 resistance level and is now testing the 1.3625 area. This breakout attempt follows several weeks of consolidation, where buyers consistently held the pair above the trendline support. The Ichimoku cloud is positioned below the price, suggesting a bullish environment, while Bollinger Bands are widening, indicating potential volatility expansion.
Momentum indicators provide mixed but cautiously bullish signals. The Stochastic oscillator is hovering near overbought territory, showing that buyers are in control but also hinting at a possible short-term pullback. Meanwhile, the Money Flow Index (MFI) is at 74, approaching the overbought zone, which aligns with the recent surge in price strength but also warns of potential profit-taking.
Looking ahead, a sustained move above 1.3625 could open the path toward the next major resistance at 1.3786. However, if the pair fails to hold above 1.3589, a pullback toward the mid-support around 1.3427 is possible. Traders should watch for confirmation signals such as candlestick rejection patterns or momentum divergence before positioning for the next directional move.
Market Observation & Strategy Advice
1. Current Position: GBPUSD is trading around 1.3625 after breaking above the 1.3589 resistance level. The pair has shown strong upward momentum supported by a bullish trendline and remains above the Ichimoku cloud.
2. Resistance Zone: Immediate resistance is seen at 1.3725. A sustained break above this level could lead to a move toward the next key resistance at 1.3786.
3. Support Zone: Initial support lies at 1.3589, followed by stronger support near 1.3427. A break below these levels may signal a shift in momentum toward bearish correction.
4. Indicators: Stochastic is near overbought, suggesting possible short-term pullback. MFI at 74 shows strong buying pressure but nearing overbought levels. Bollinger Bands are widening, indicating volatility expansion.
5. Trading Strategy Suggestions:
- Bullish Scenario: If GBPUSD sustains above 1.3625, buyers could push the price toward 1.3786. Traders may consider long positions on a confirmed breakout with bullish candlestick patterns or continued momentum support from indicators.
- Bearish Scenario: Failure to hold above 1.3625 and a drop below 1.3589 could trigger selling pressure, exposing the pair to 1.3427 as the next support. Short setups may be considered if Stochastic turns downward and MFI confirms weakening demand.
- Neutral/Range Scenario: As long as GBPUSD stays between 1.3589 and 1.3625, the pair may consolidate in a narrow range. Range traders can exploit short-term opportunities by buying near support and selling near resistance until a breakout is confirmed.
Market Performance:
Forex Last Price % Change
EUR/USD 1.1823 +0.09%
USD/JPY 146.91 −0.02%
Today’s Key Economic Calendar:
US: Fed Interest Rate Decision
US: FOMC Economic Projections
US: Fed Press Conference
UK: BoE Interest Rate Decision
Risk Disclaimer This report is for informational purposes only and does not constitute financial advice. Investments involve risks, and past performance does not guarantee future results. Consult your financial advisor for personalized investment strategies.
风险提示:本文所述仅代表作者个人观点,不代表 Followme 的官方立场。Followme 不对内容的准确性、完整性或可靠性作出任何保证,对于基于该内容所采取的任何行为,不承担任何责任,除非另有书面明确说明。


加载失败()