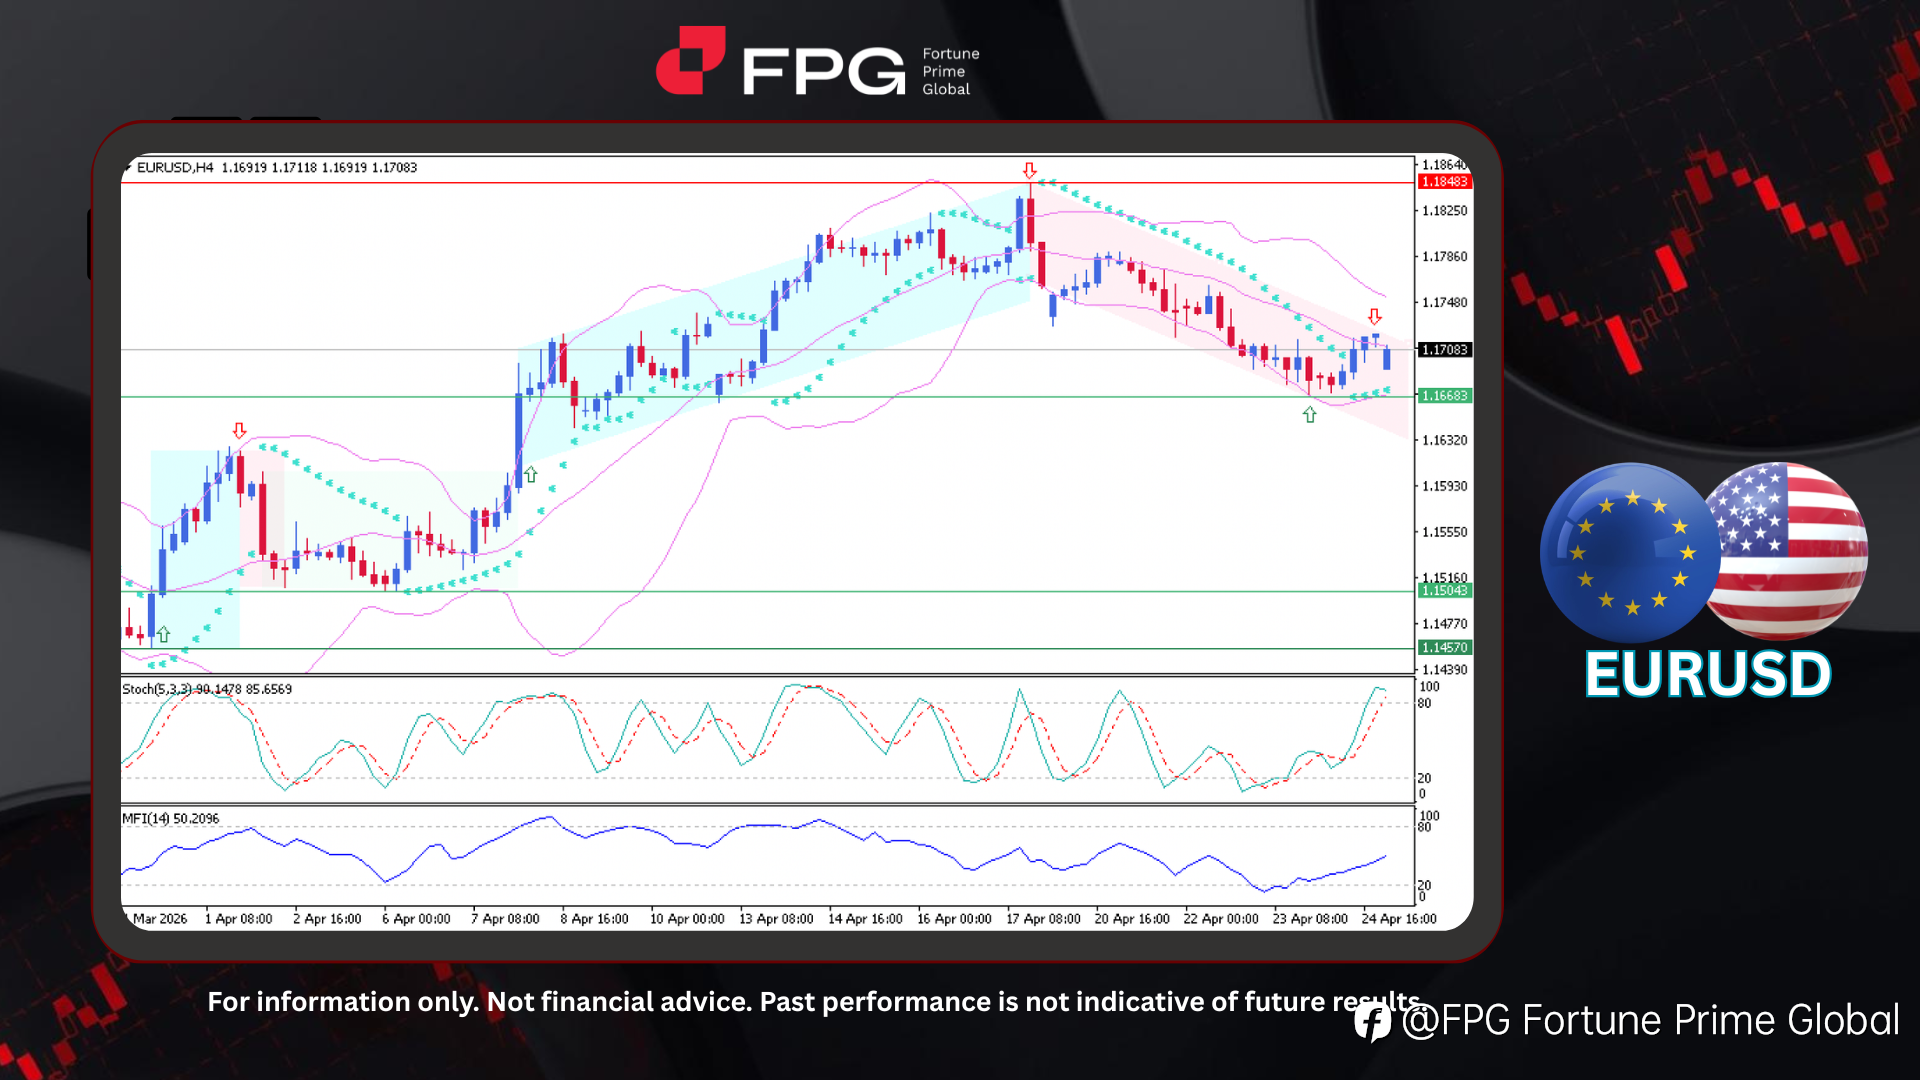
FPG EURUSD Market Report April 27, 2026
On the H4 timeframe chart, EURUSD shows a transition from a strong bullish phase into a sustained bearish correction. Price initially rallied from 1.1457 to 1.1848, forming a clear upward structure before encountering strong resistance and reversing direction. Following this rejection, the market ha
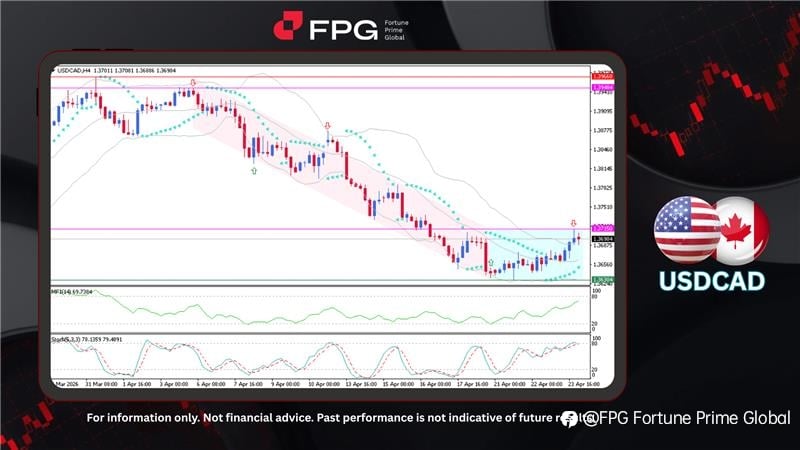
FPG USDCAD Market Report April 24, 2026
On the H4 timeframe chart, USDCAD is starting to show signs of strength after previously experiencing a prolonged and consistent bearish rally. Earlier, the pair declined from 1.3948 to 1.3630, and from that point, a support rebound emerged, providing enough momentum to shift the trend slightly bull
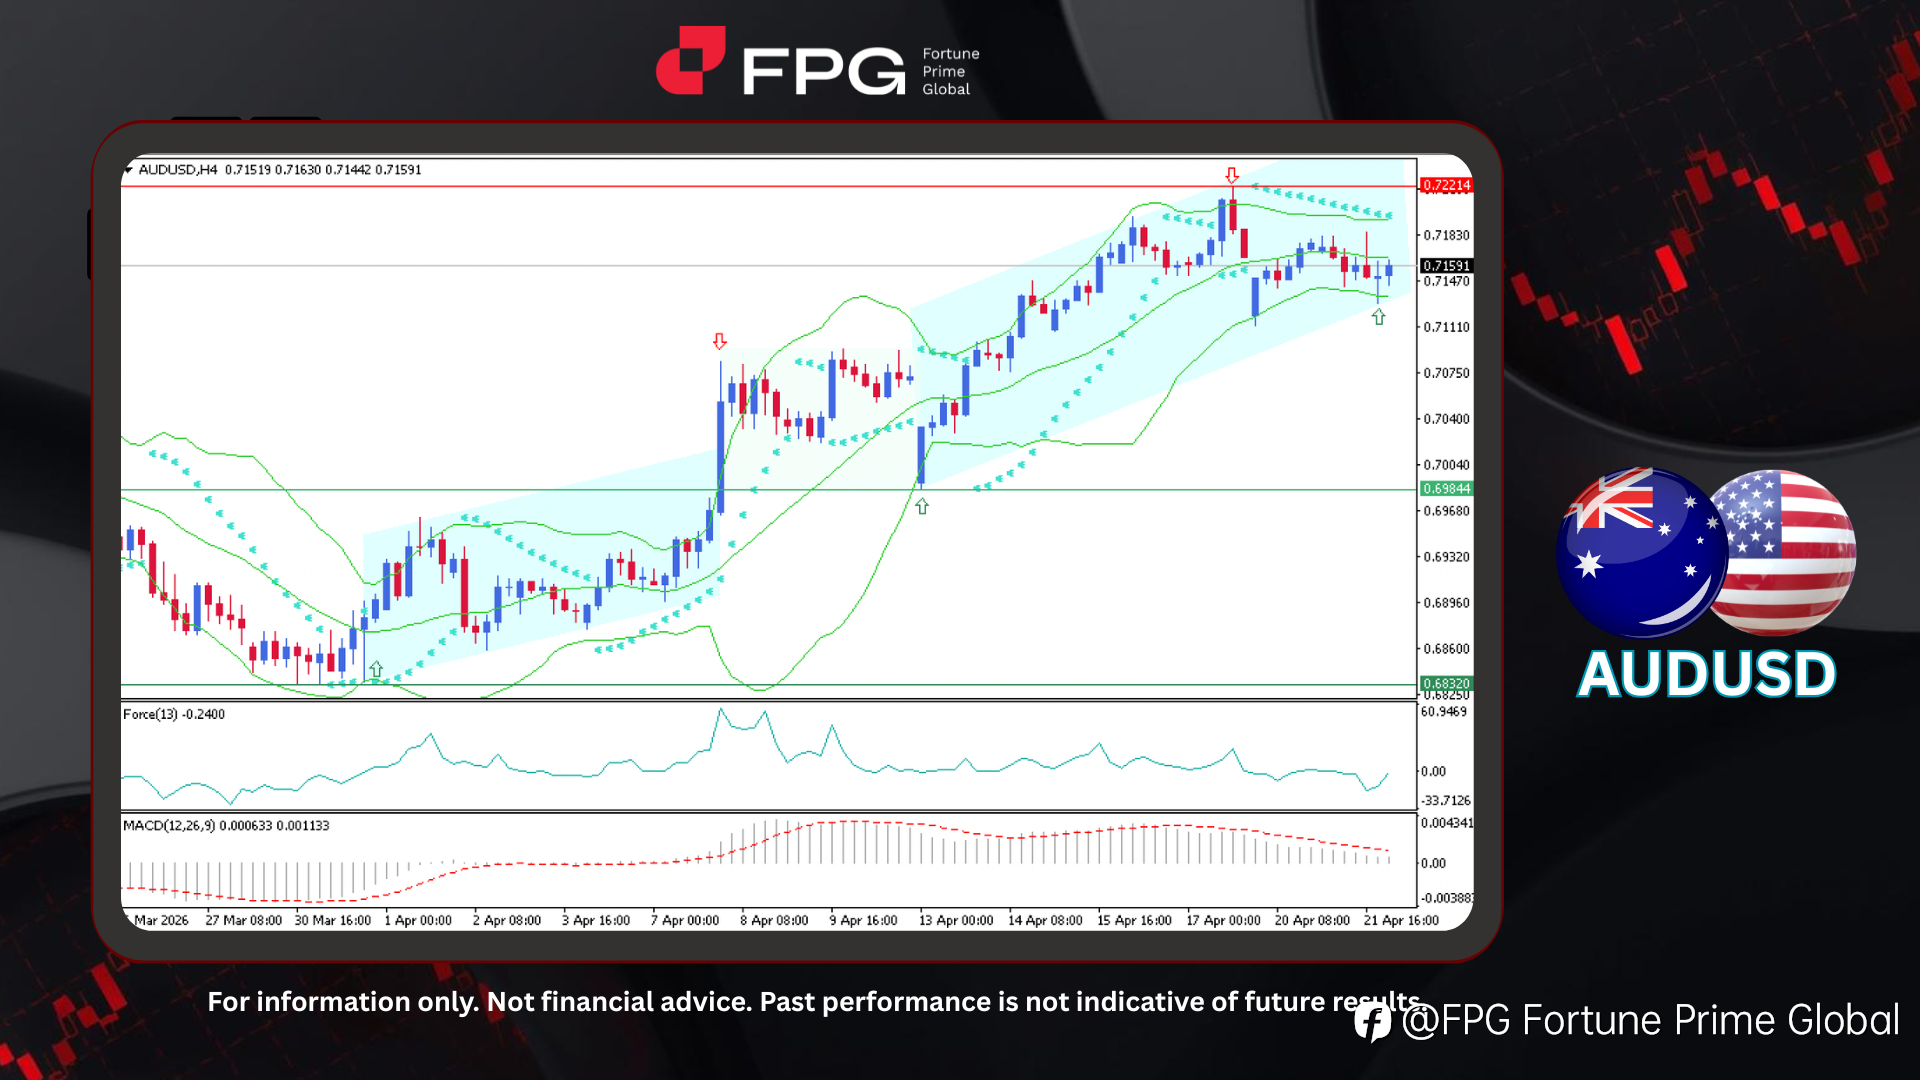
FPG AUDUSD Market Report April 22, 2026
On the H4 timeframe chart, AUDUSD shows a well-established bullish structure, continuing its upward trajectory within a clear ascending channel. The rally began from 0.6832, followed by a consolidation phase between 0.6984 and 0.7090 before price resumed its upward movement. This sustained bullish m
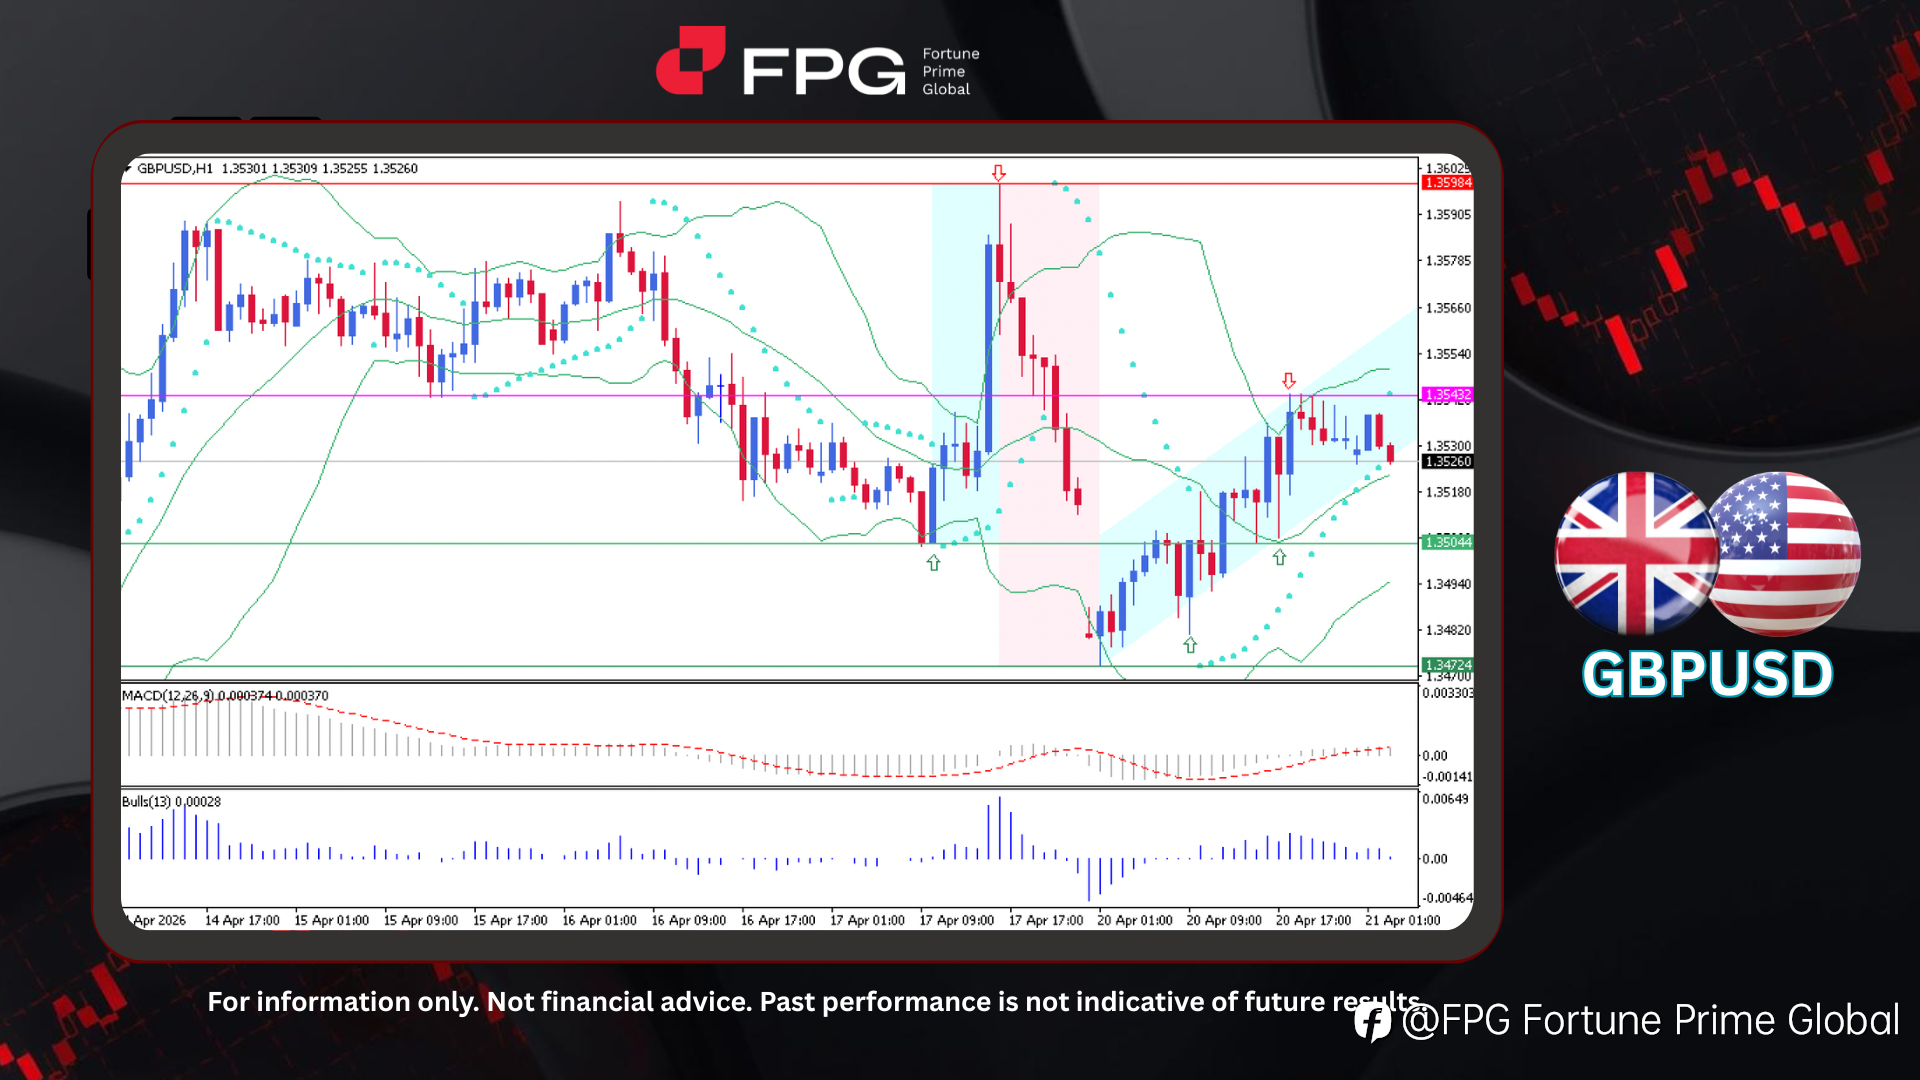
FPG GBPUSD Market Report April 21, 2026
On the H1 timeframe chart, GBPUSD shows a sharp bullish impulse followed by a corrective phase and an early-stage recovery. Price previously surged from 1.3504 to 1.3598, forming a strong bullish spike before encountering resistance and reversing downward toward 1.3472. From this low, the market beg
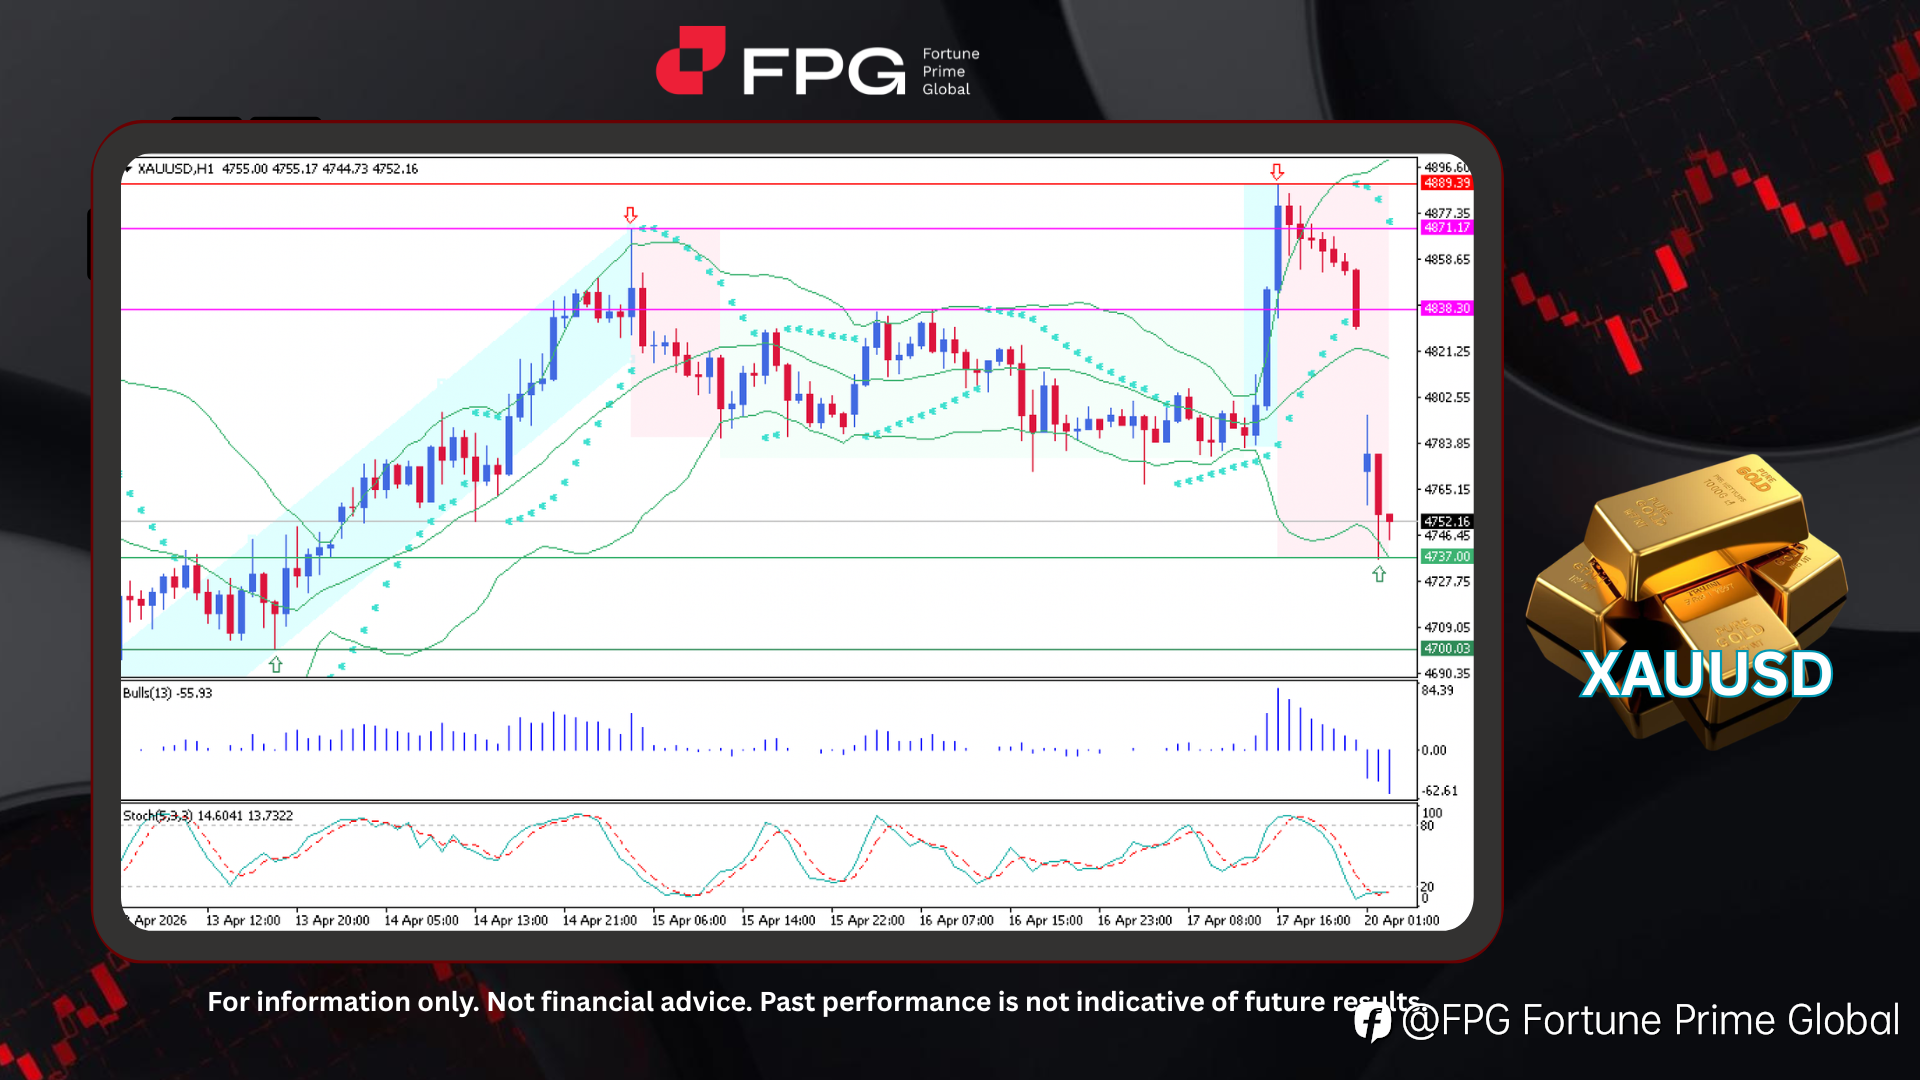
FPG XAUUSD Market Report April 20, 2026
XAUUSD (Gold) on the H1 timeframe chart has recently experienced a fairly significant price drop from 4889 to 4737. A week ago, there was a bullish rally from around 4700, forming a bullish channel up to 4871. This was followed by a period of price consolidation lasting several days. Price then atte
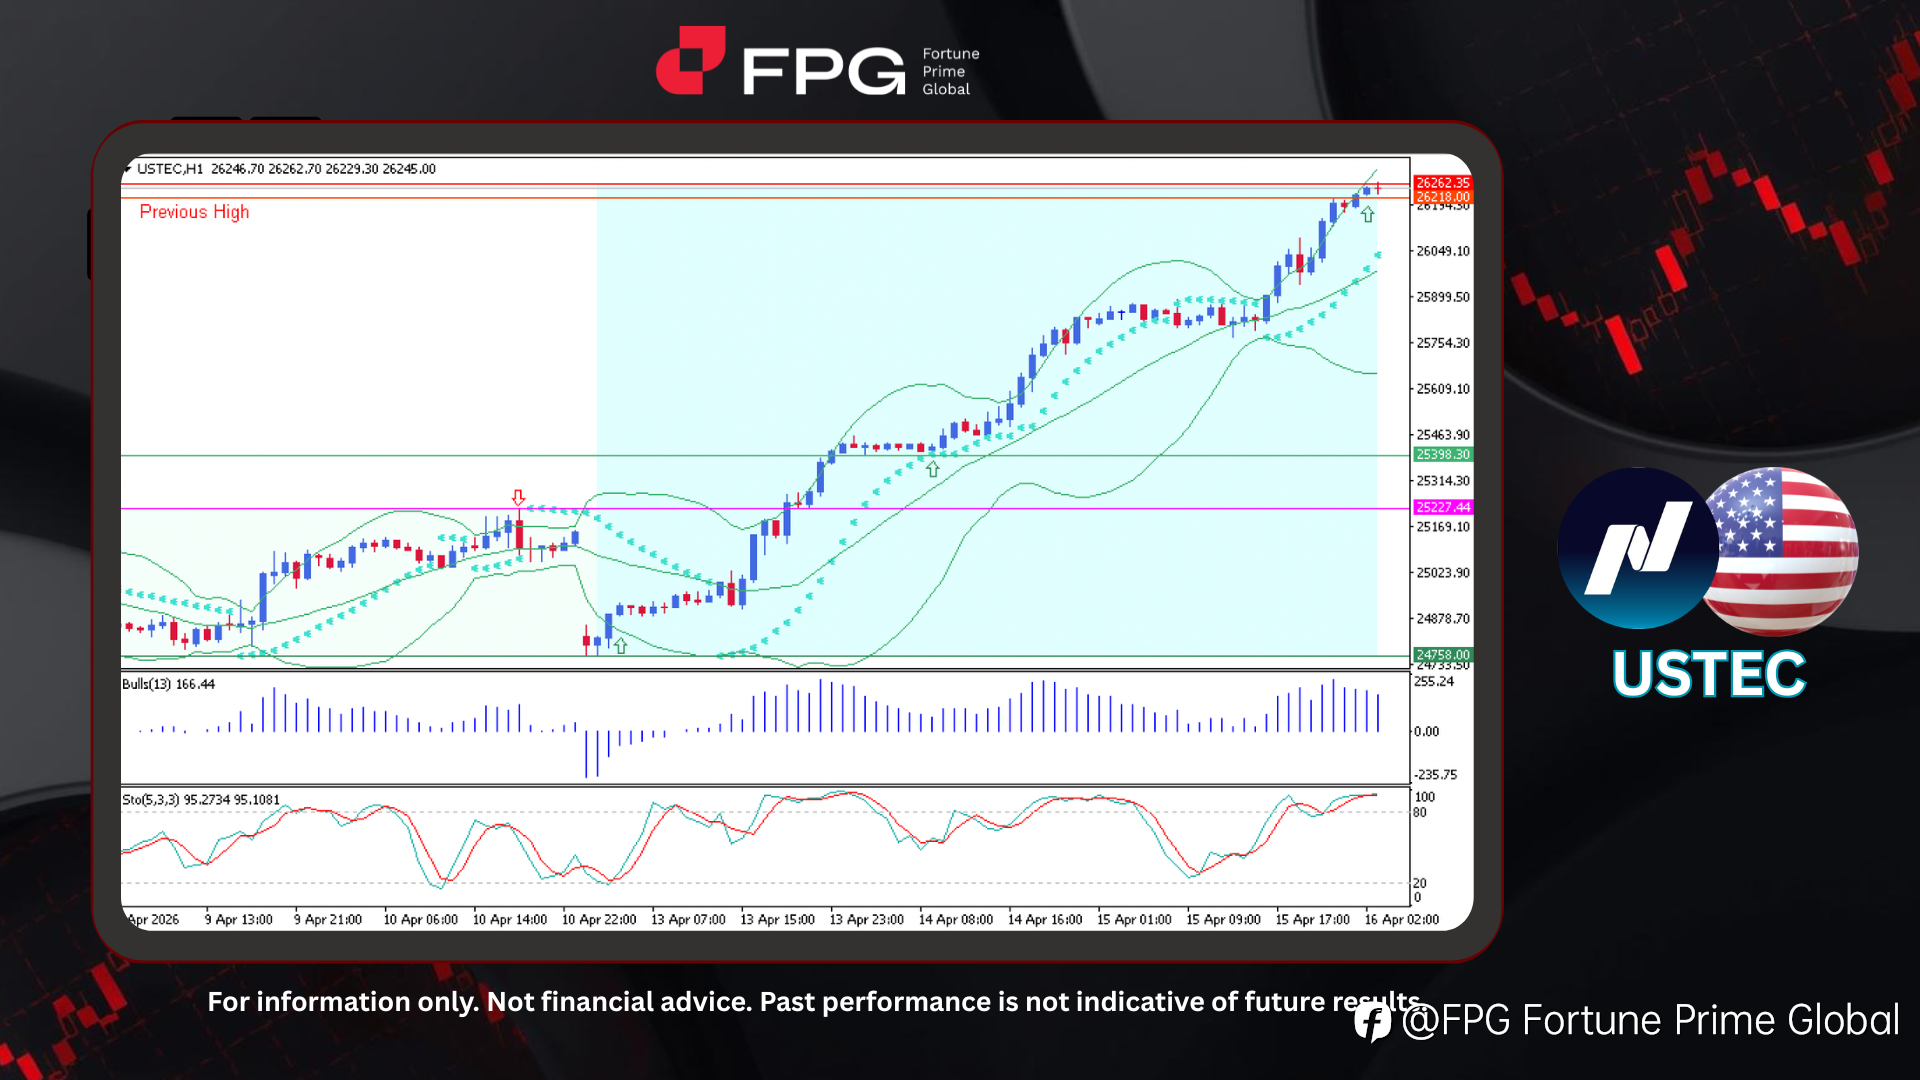
FPG USTEC Market Report April 16, 2026
USTEC (Nasdaq-100) on the H1 timeframe chart is currently forming a new All-Time High, with the latest peak recorded around 26,262. There remains potential for another new All-Time High to be established in the near term. The previous high from January stood at 26,218, which has now been successfull
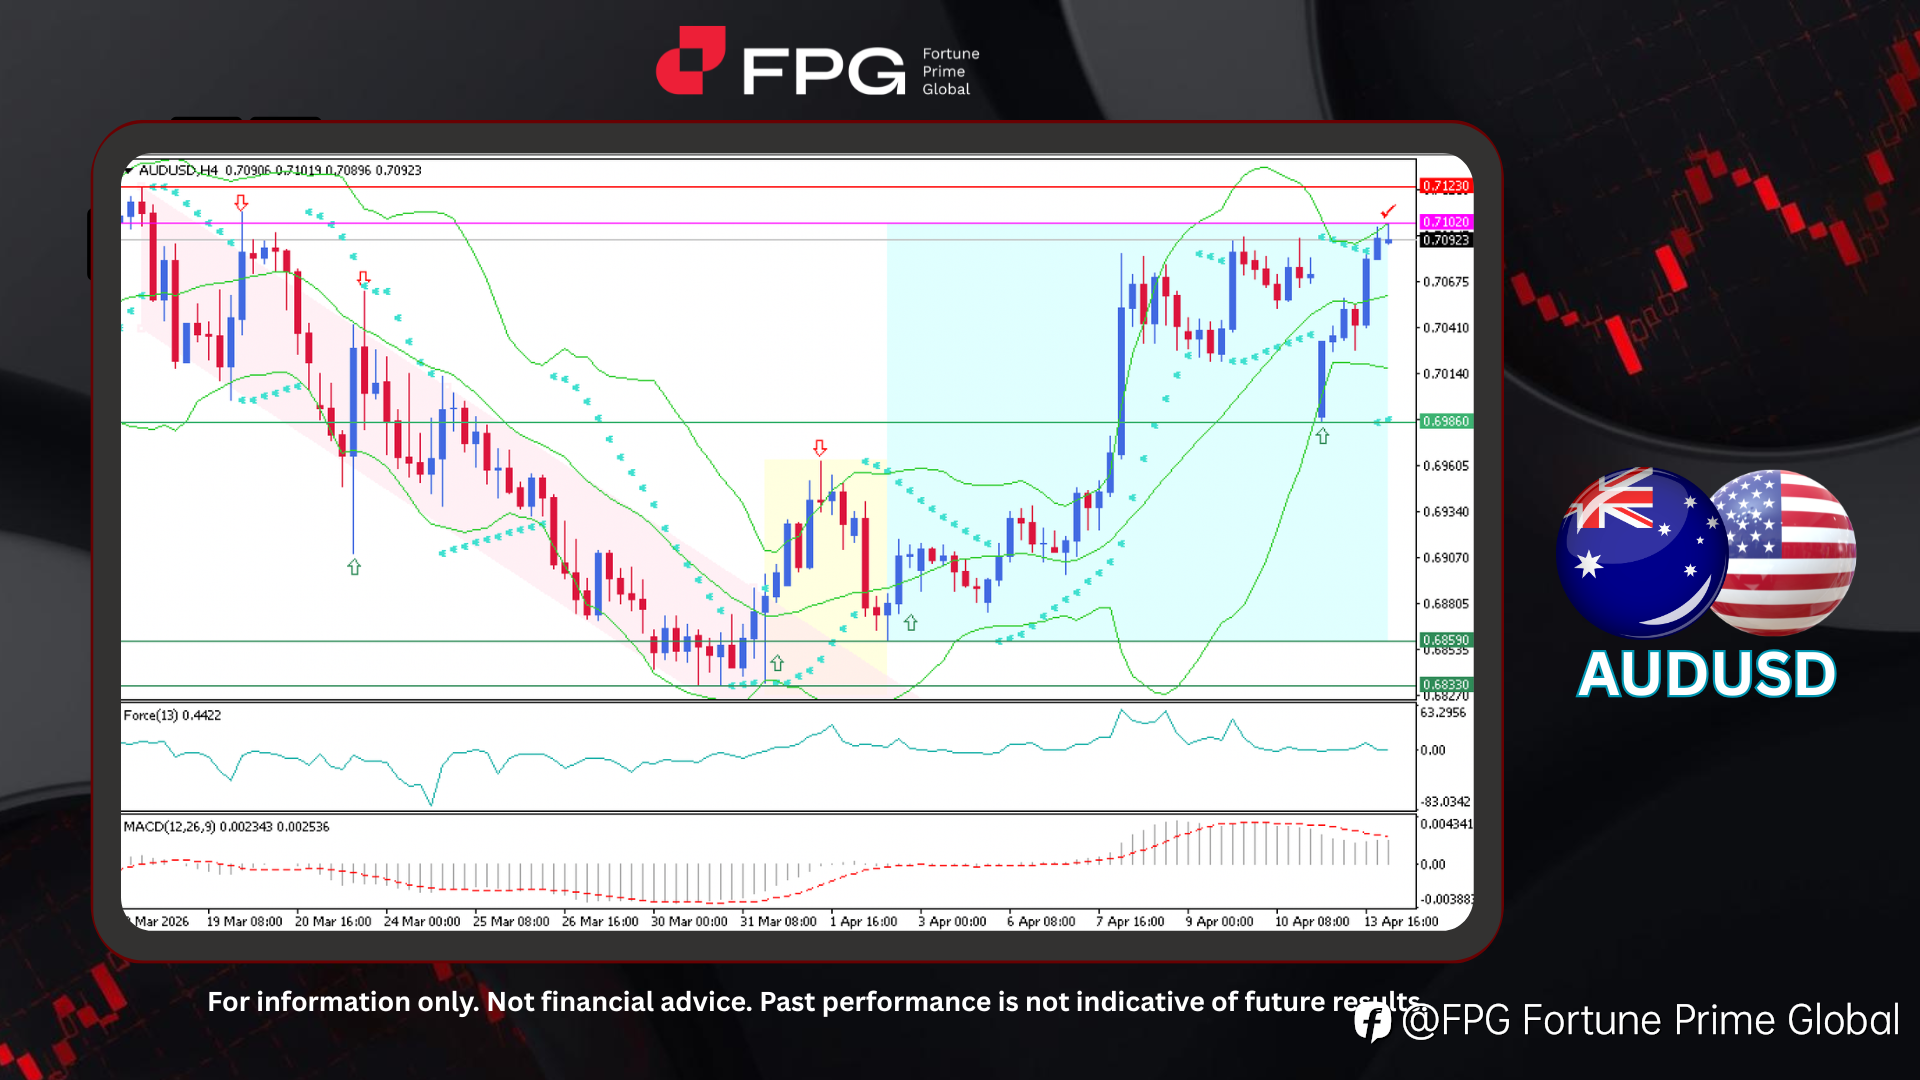
FPG AUDUSD Market Report April 14, 2026
On the H4 timeframe chart, AUDUSD shows a clear transition from a prior bearish trend into a sustained bullish phase. Previously, price declined from 0.7123 to 0.6833, establishing a strong bearish structure. This was followed by a consolidation phase before a bullish reversal formed around 0.6859,
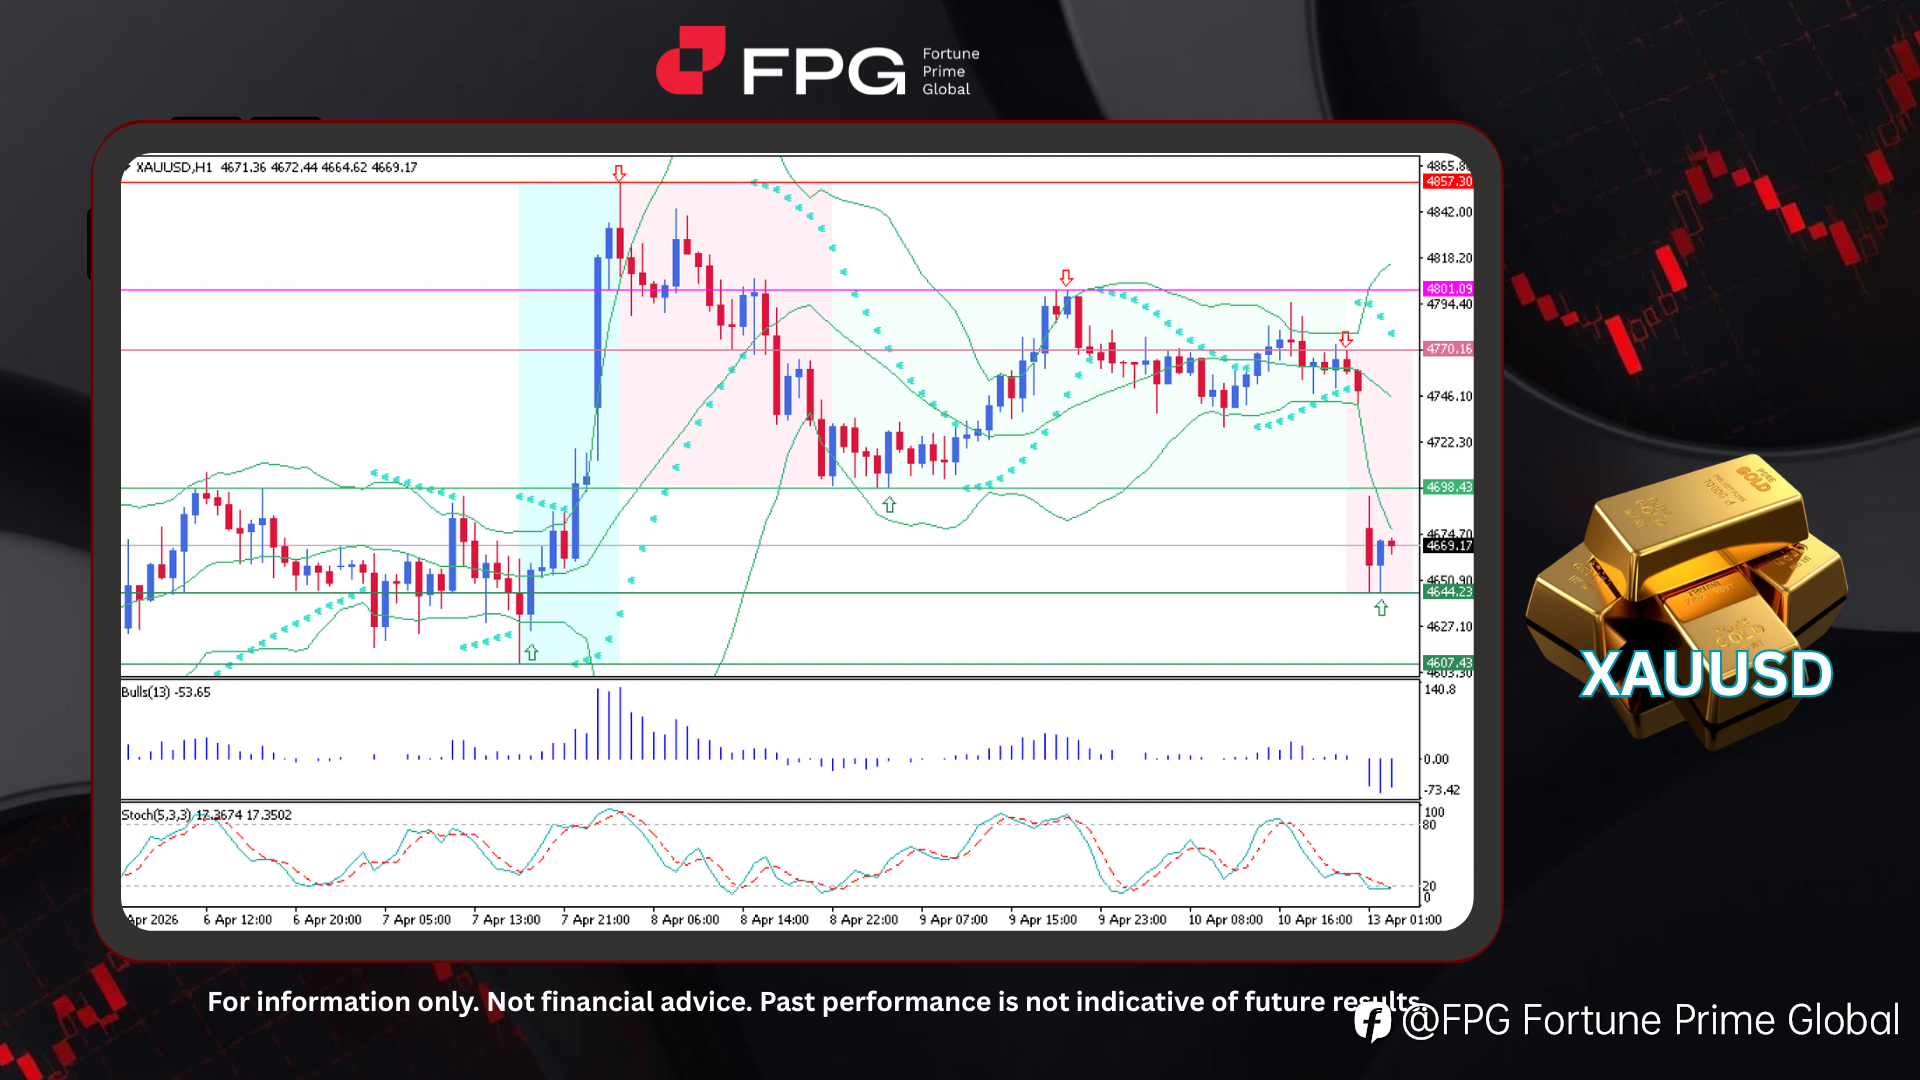
FPG XAUUSD Market Report April 13, 2026
On the H1 timeframe chart, XAUUSD (Gold) has recently experienced a sharp bearish move, dropping from 4770 to 4644, signaling a strong wave of selling pressure. Looking at the broader structure, price previously rallied from 4607 to 4857, forming a solid bullish trend before encountering a major rej
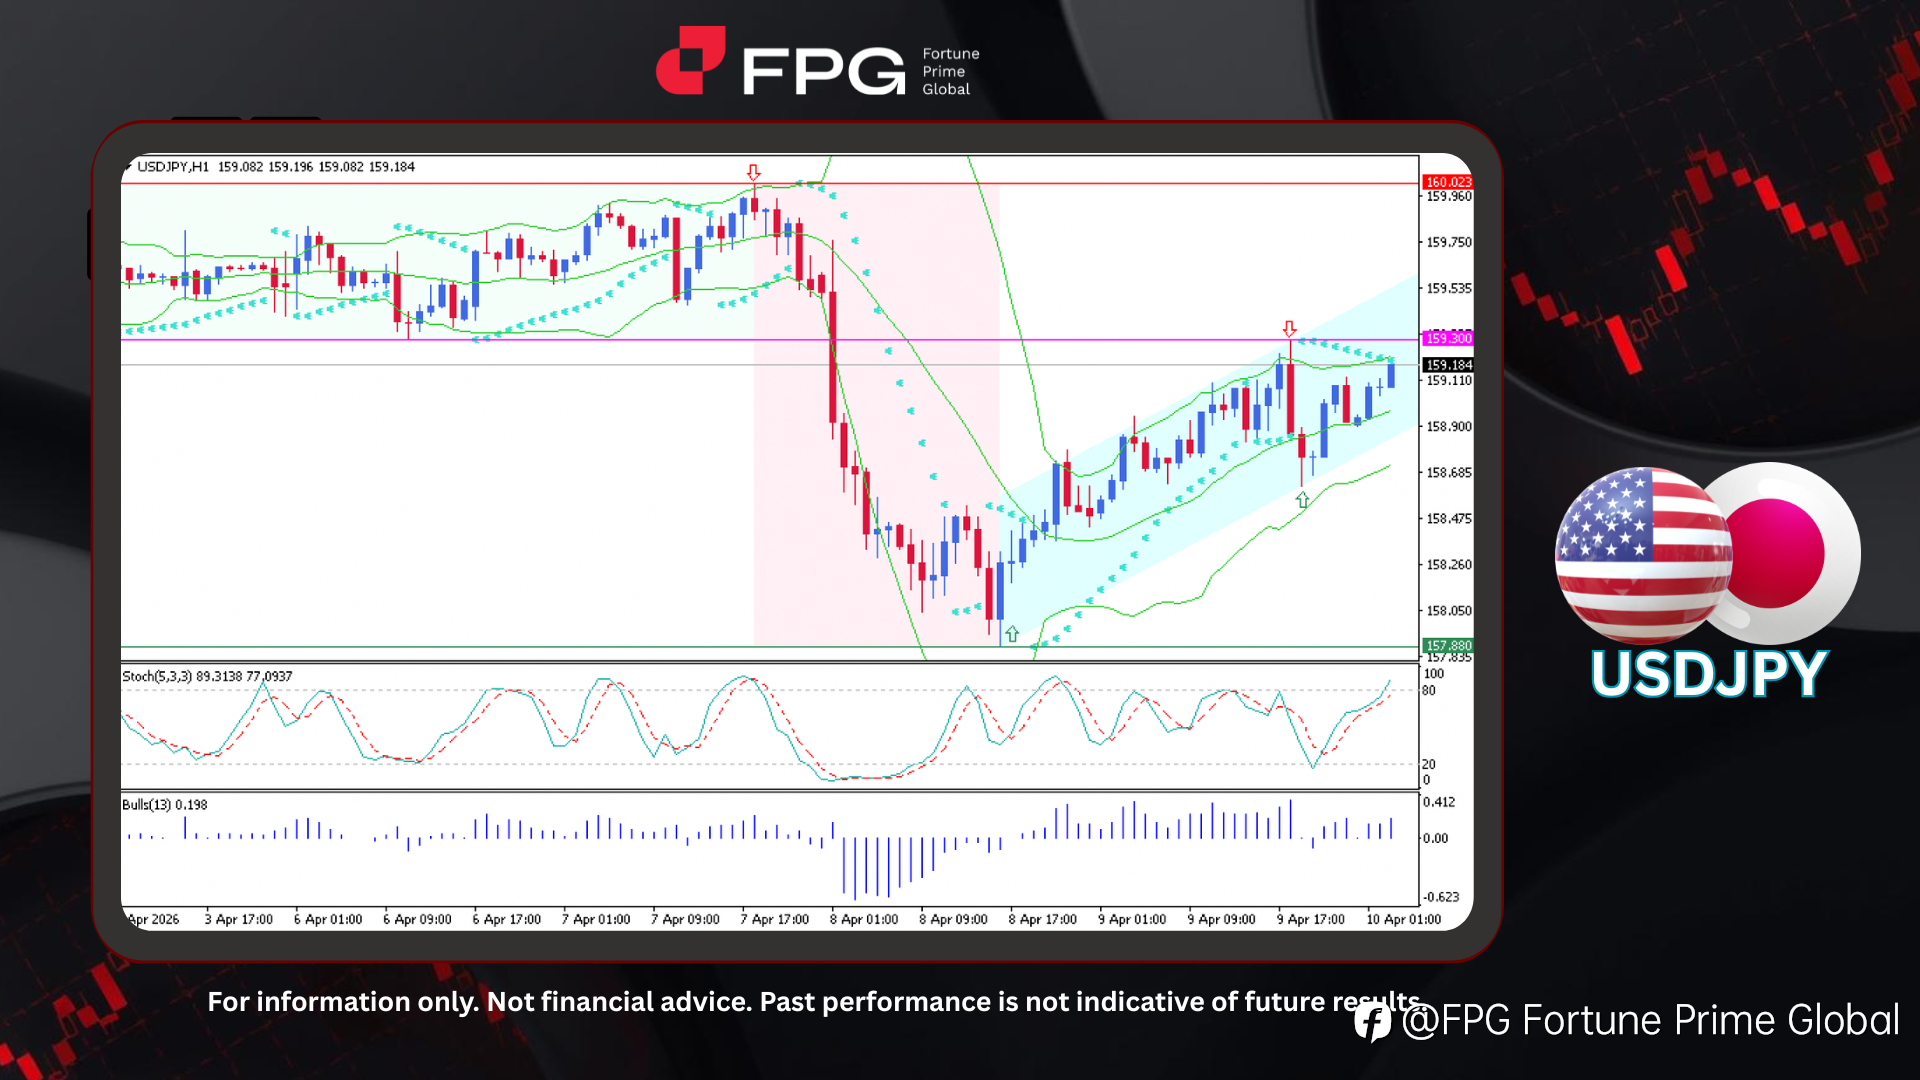
FPG USDJPY Market Report April 10, 2026
On the H1 timeframe chart, USDJPY initially moved within a relatively stable sideways channel at the beginning of the month. A sharp price drop then occurred, falling from 160.02 to 157.88 and forming significant bearish candles. From this low point, the trend reversed into a bullish movement, formi
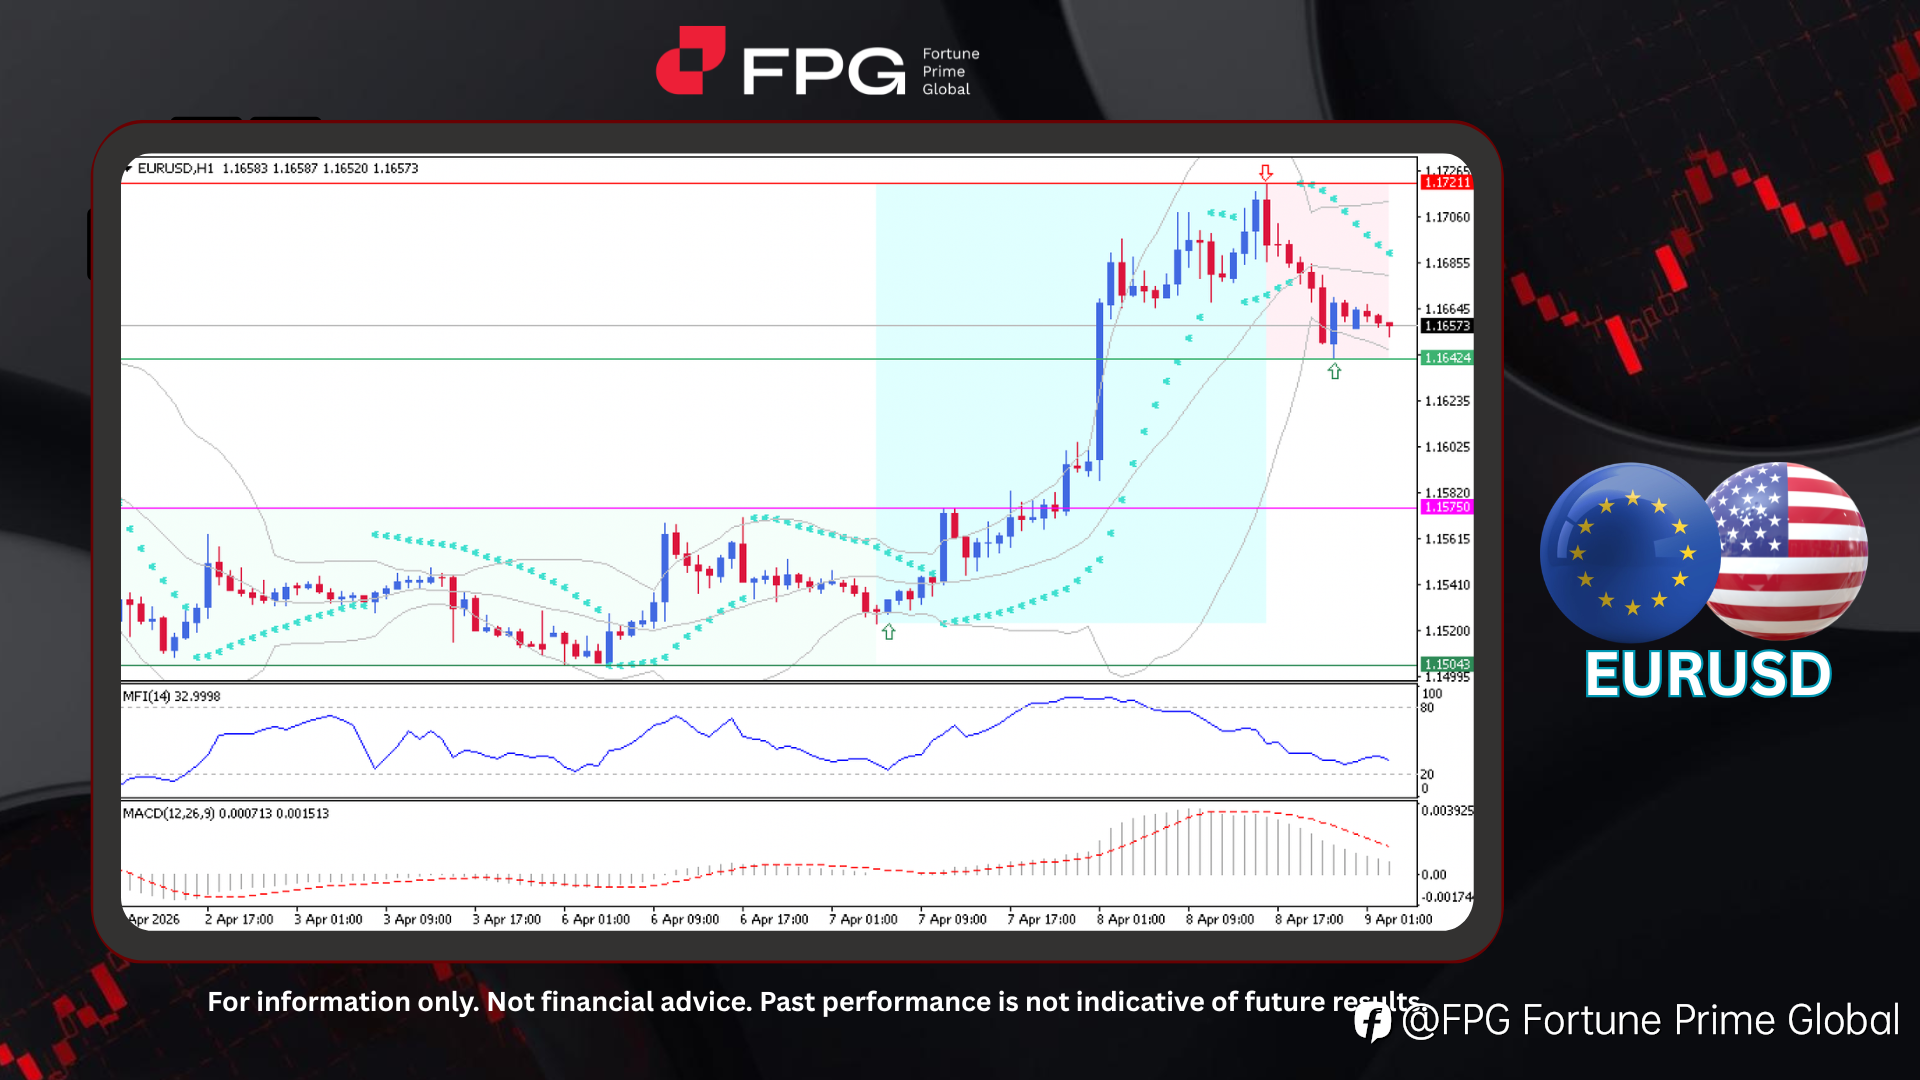
FPG EURUSD Market Report April 9, 2026
On the H1 timeframe chart, EURUSD initially moved in a relatively stable sideways range between 1.1504 and 1.1575, reflecting a consolidation phase at the beginning of the month. A couple days ago, a strong bullish breakout occurred, pushing the price above resistance and driving it up to a peak at
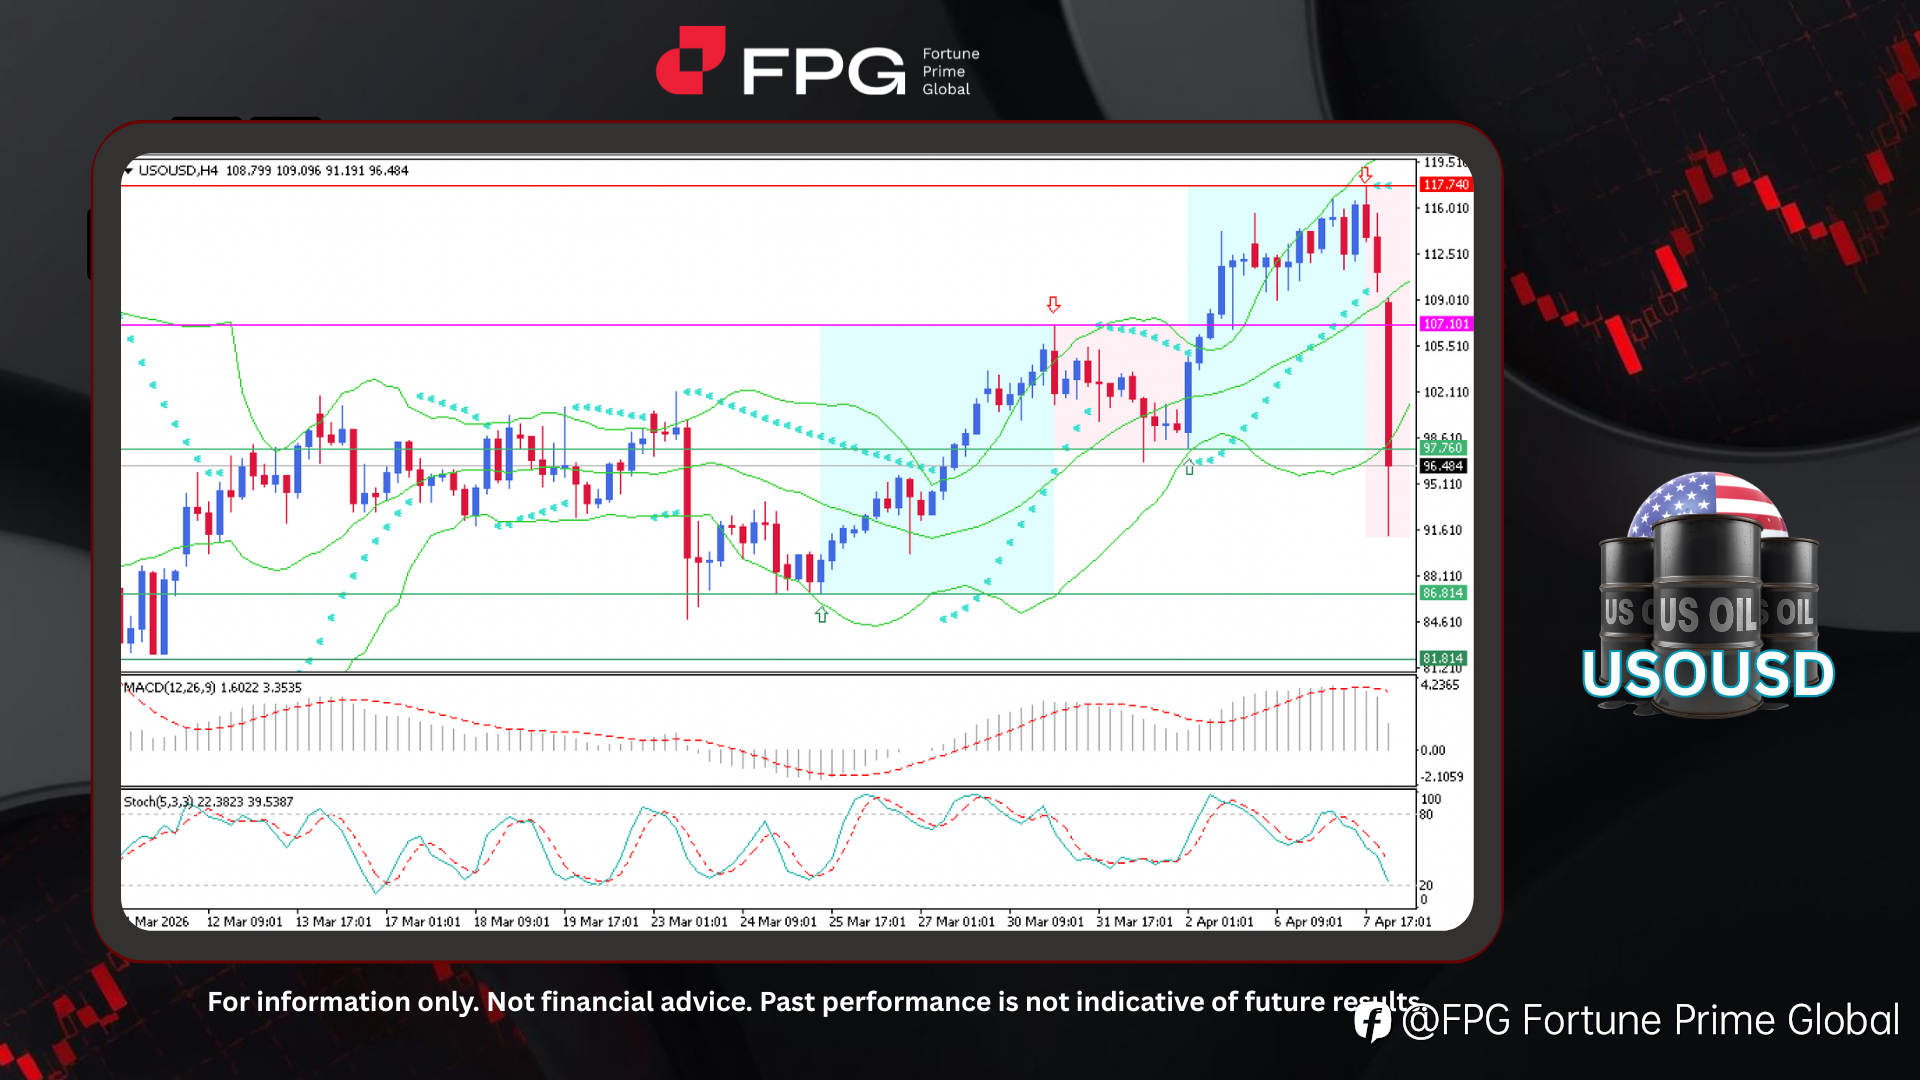
FPG USOUSD Market Report April 8, 2026
On the H4 timeframe chart, USOUSD shows a very significant price drop. Previously, the market formed two consecutive bullish rallies, starting from 86.81 and advancing to 107.10, before undergoing a bearish correction toward 97.76. After this pullback, the price resumed its upward movement and conti
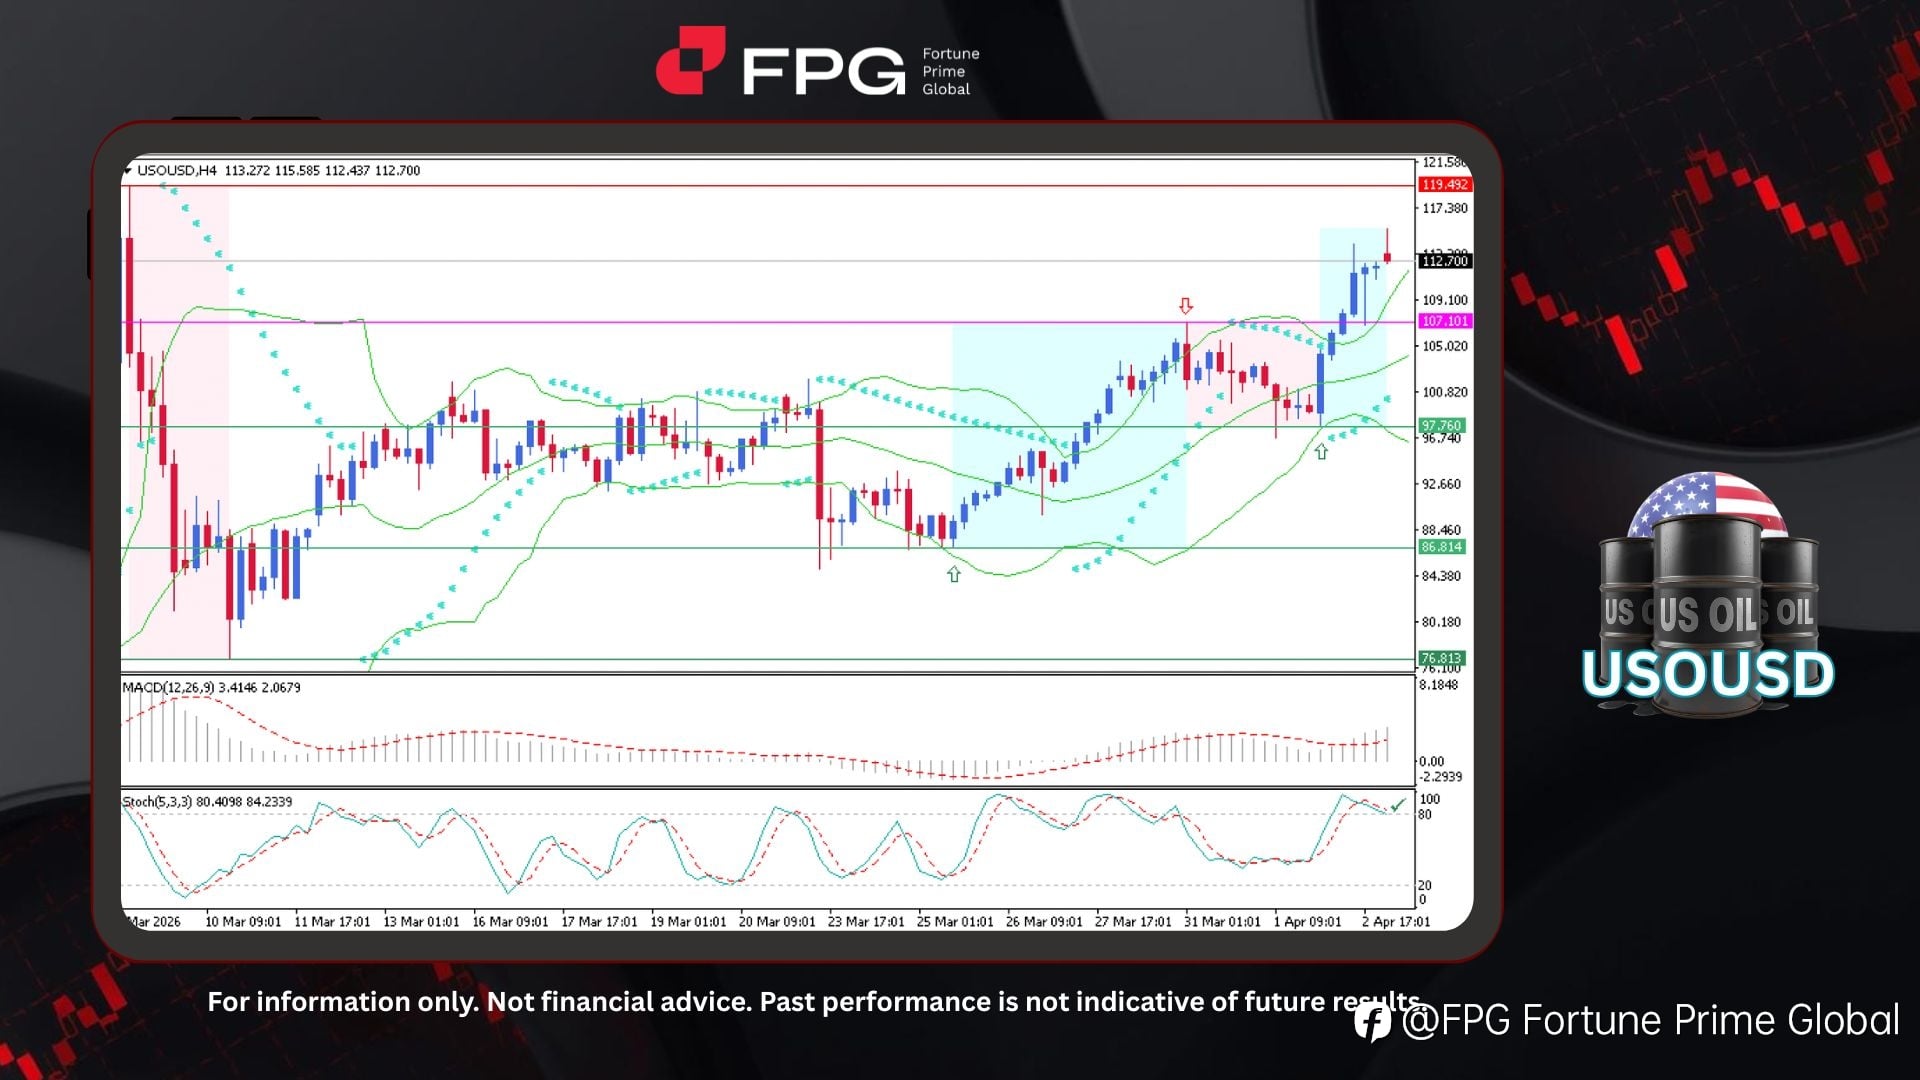
FPG USOUSD Market Report April 6, 2026
On the H4 timeframe chart, USOUSD shows that the latest price trend has successfully broken above the resistance at 107.10, with the current price trading around 112.70 under relatively high volatility. After previously experiencing a sharp decline from 119.49 to 76.81 at the beginning of last month
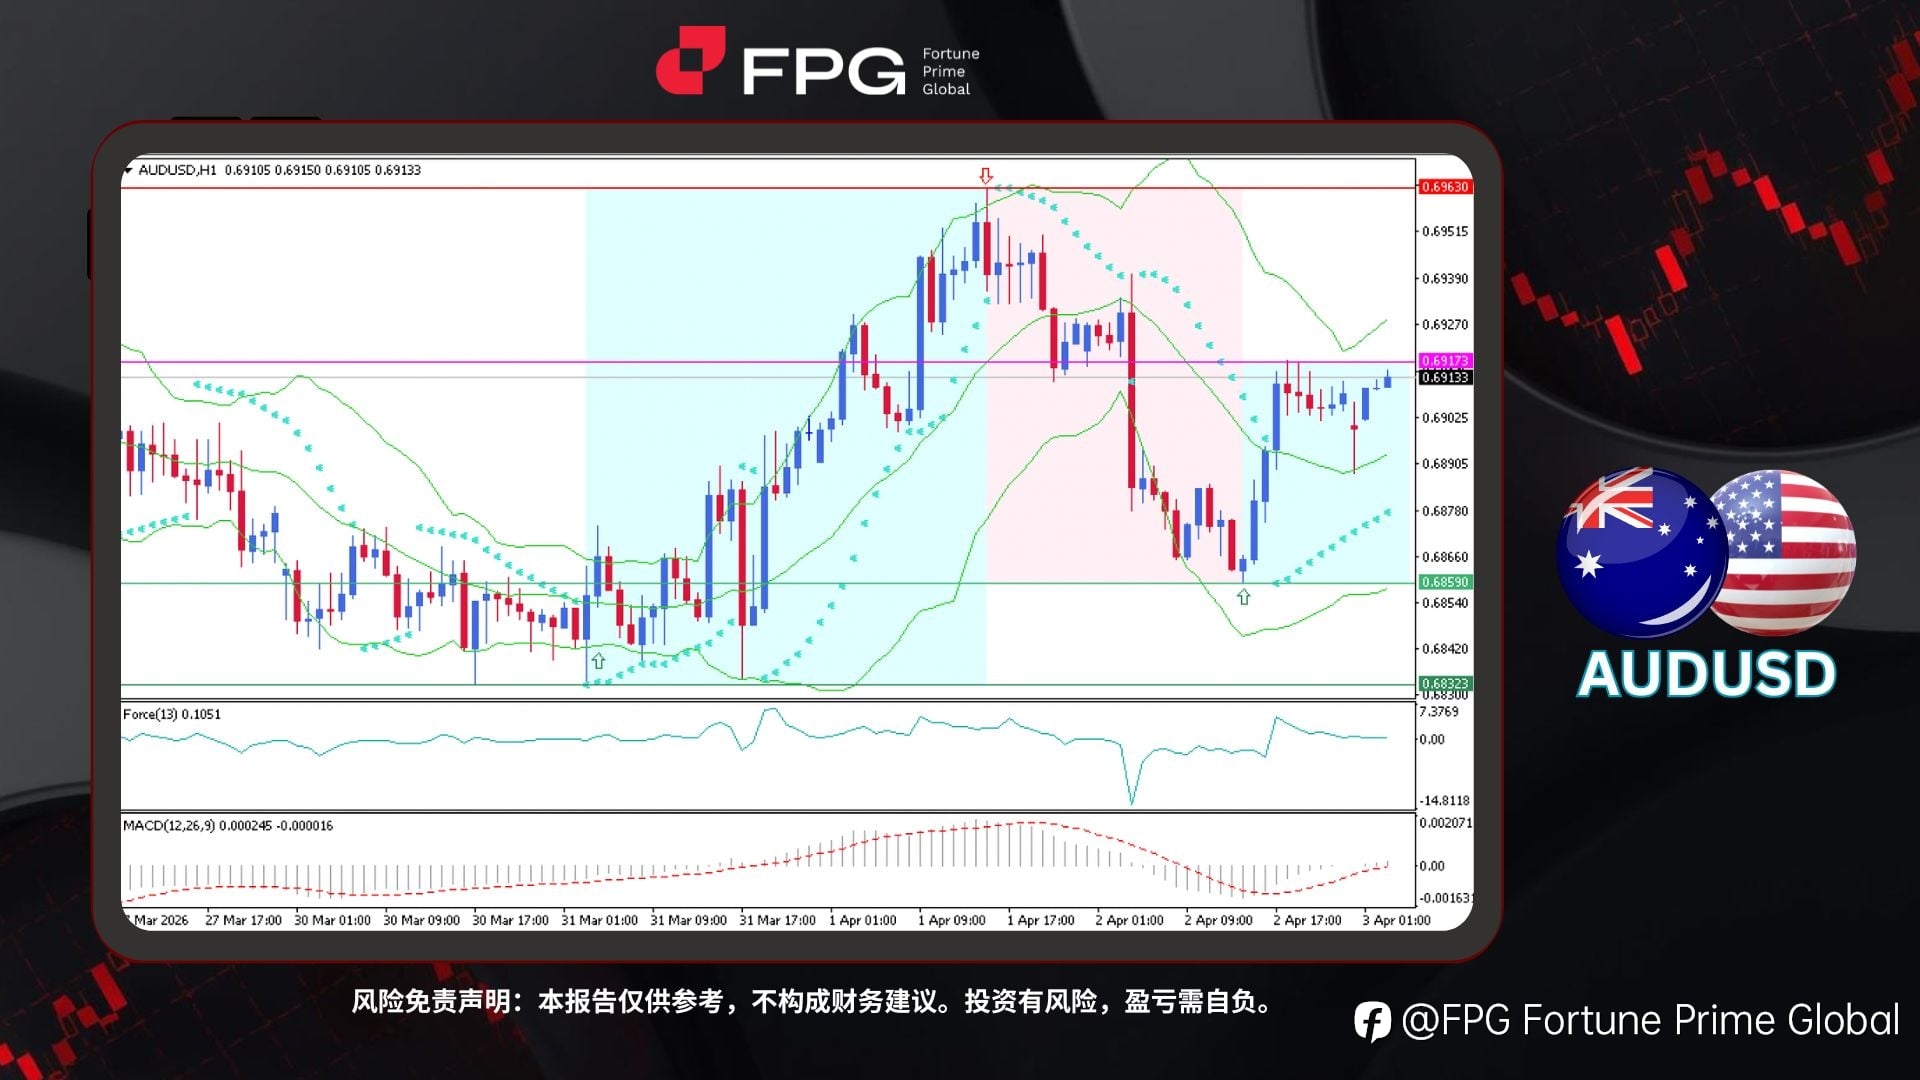
FPG AUDUSD Market Report April 3, 2026
On the H1 timeframe chart, AUDUSD exhibited a strong bullish rally toward the end of last month, advancing from 0.6832 to a peak at 0.6963. Following this high, a clear price rejection emerged, triggering a sharp decline toward 0.6859. However, buying momentum re-entered the market from this level,
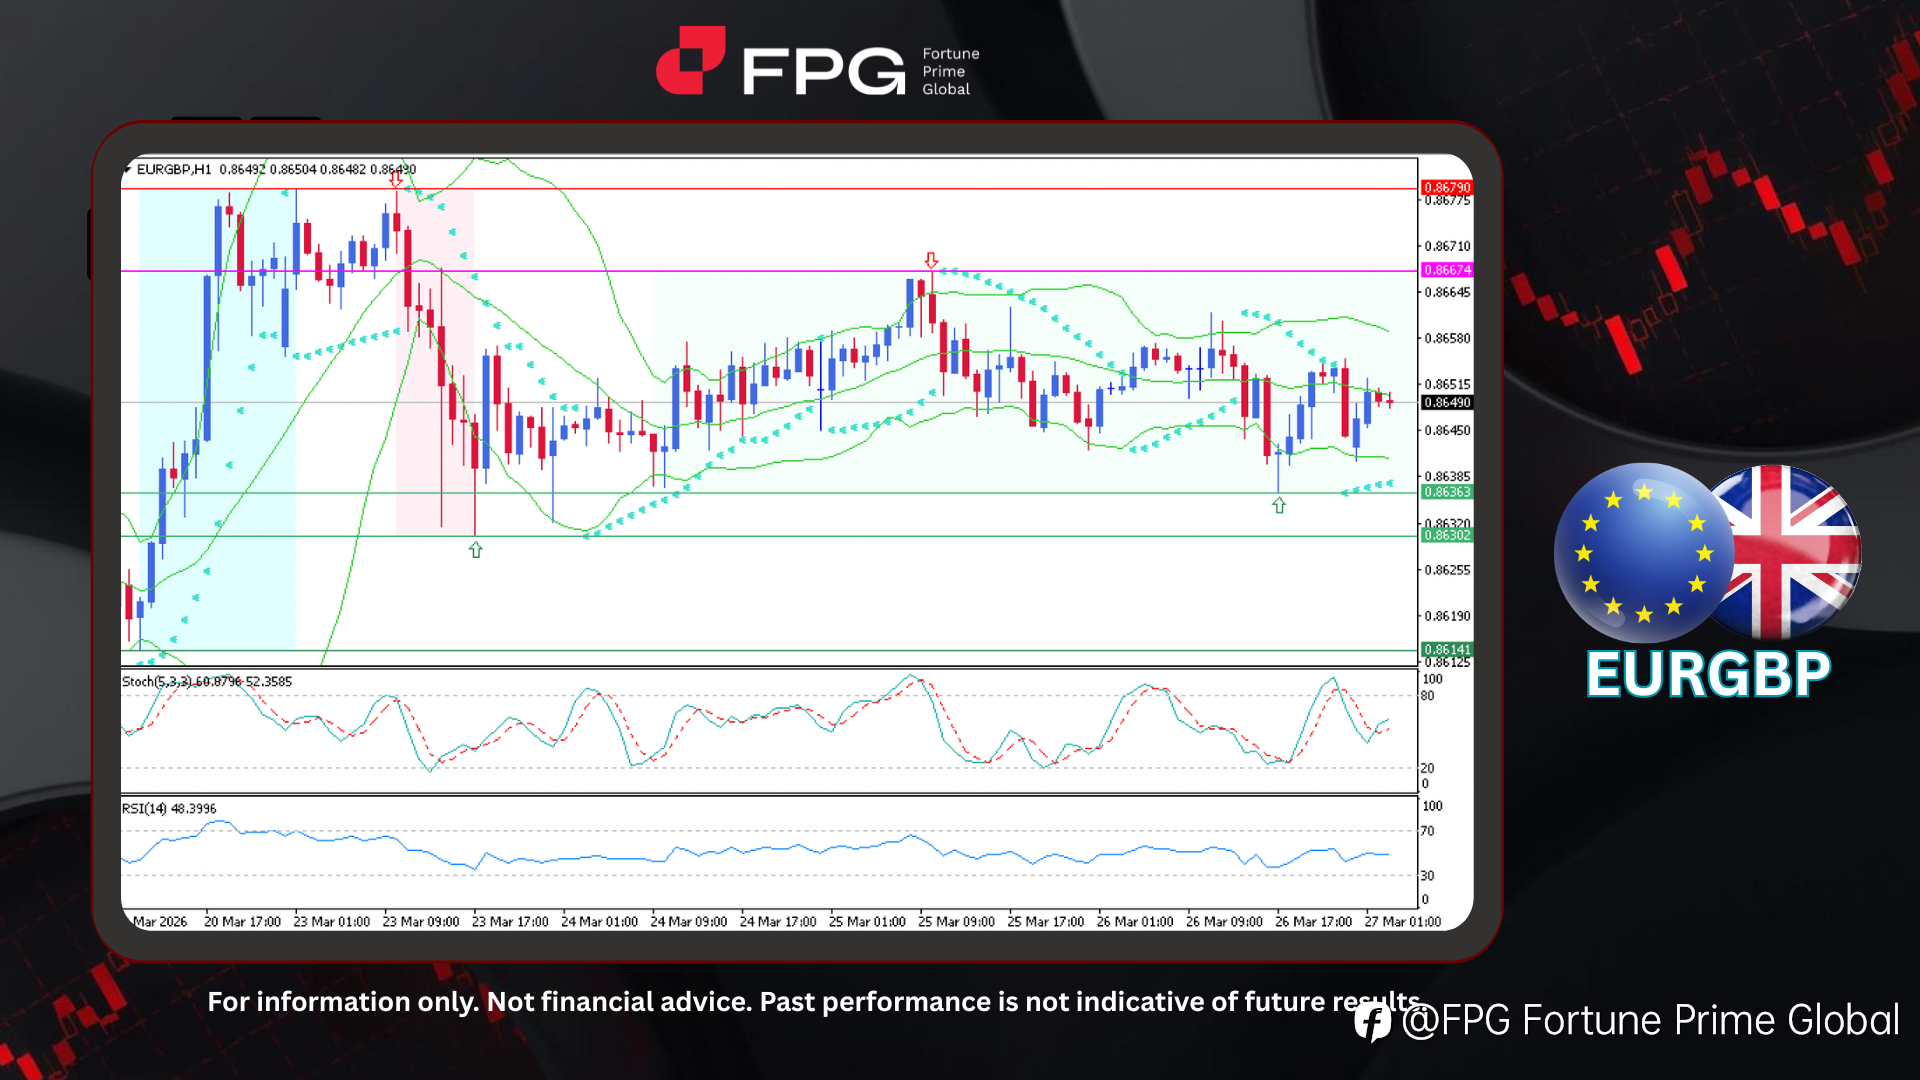
FPG EURGBP Market Report March 27, 2026
On the H1 timeframe chart, EURGBP showed a bullish rally last week, rising from 0.8614 and peaking at 0.8679. After several attempts to retest this resistance level, a price rejection occurred, leading to a bearish drop toward 0.8630. Following this move, price action stabilized and consolidated wit
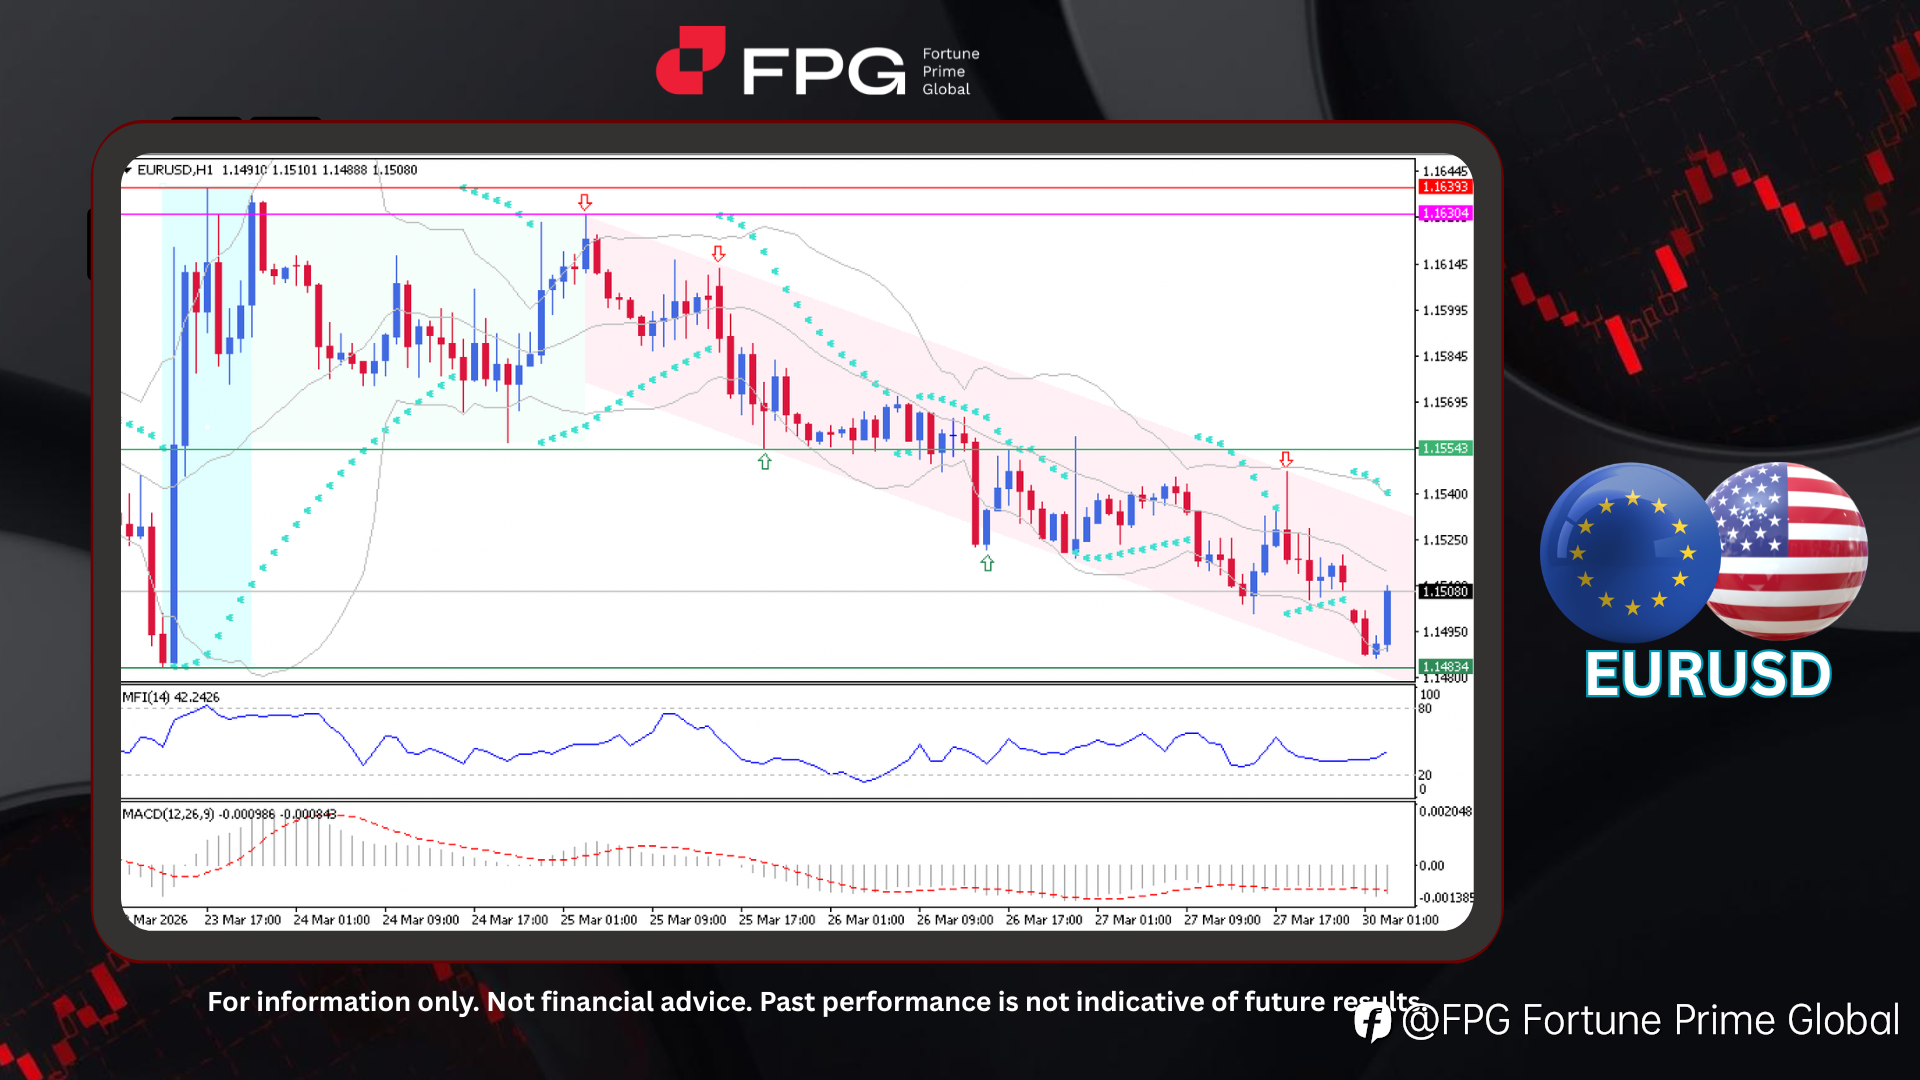
FPG EURUSD Market Report March 30, 2026
On the H1 timeframe chart, EURUSD showed a strong bullish rally at the beginning of last week, surging from 1.1483 to 1.1639. However, it failed to sustain the upward momentum from that peak, leading to a trend reversal into a consistent and prolonged bearish trend, forming a well-defined descending
正在加载中...
