· 阅读量 23,098
In trading, understanding market behavior is crucial for making the right decisions. Followme provides two key data sets that help traders gain deeper insights into market movements: Pending Order Data and Position Data. With these two tools, you can visualize potential support and resistance zones, market sentiment, and even the likelihood of breakouts.This #LearnFollowme article explains what these charts mean, how they work, and how you can use them to improve your trading strategy.
What Data Is Available?
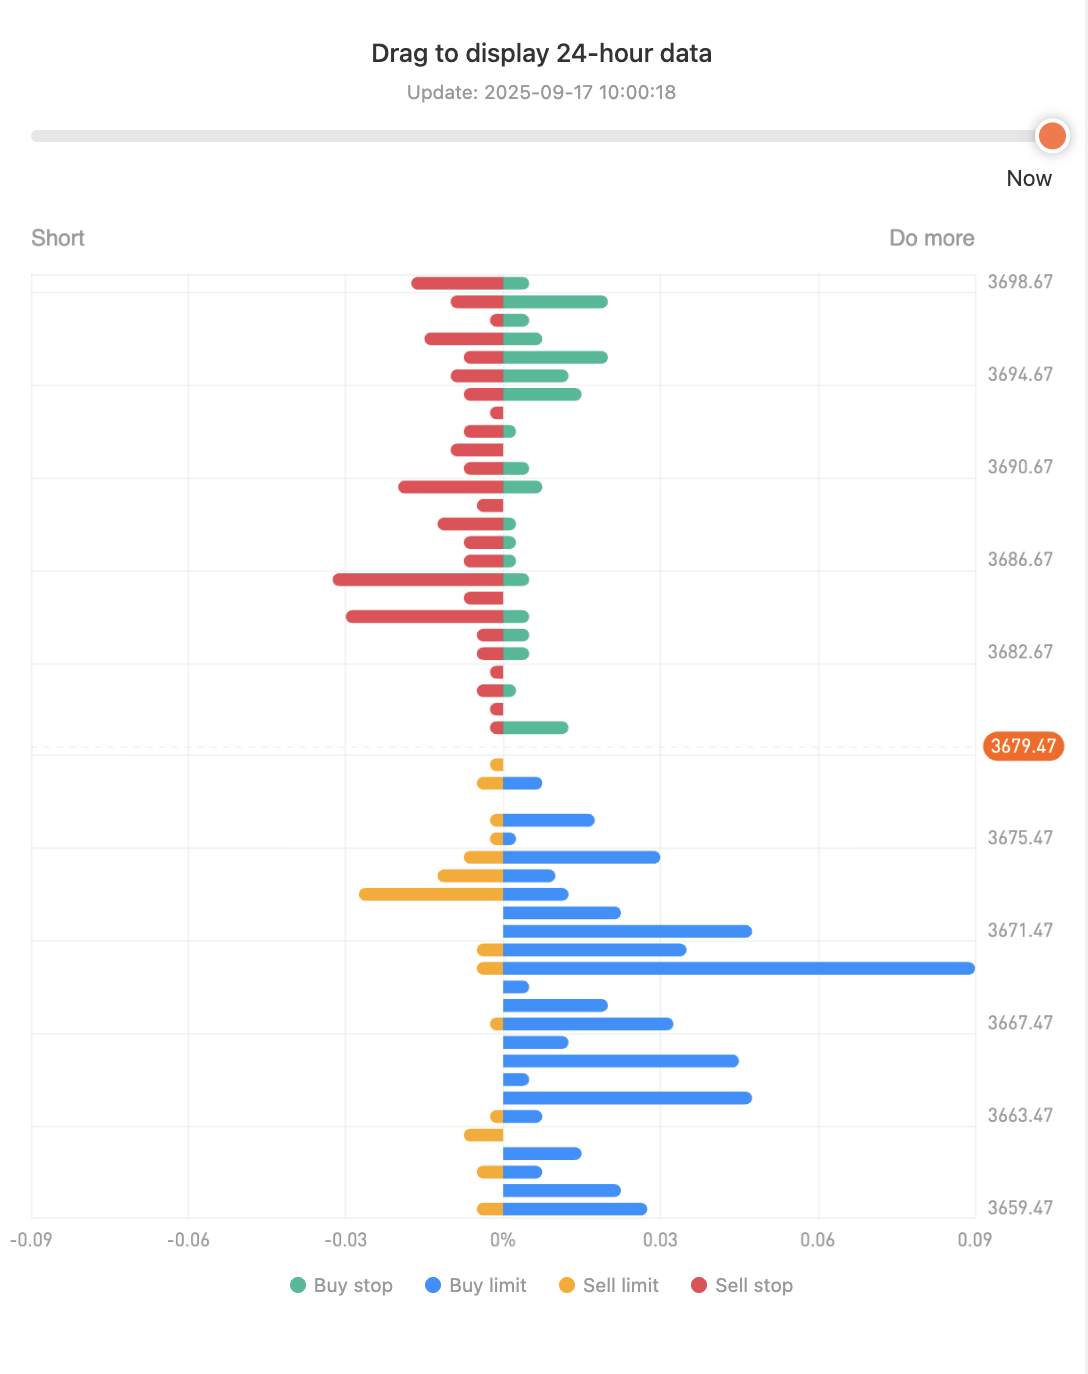
The first is Pending Order Data, which shows the distribution of traders’ orders that have not yet been executed. It highlights the price levels where many traders are aiming to buy or sell.
Each color represents a specific type of order:
-
Green (Buy Stop): Traders expect the price to rise and will buy if it breaks above a certain level.
-
Blue (Buy Limit): Traders want to buy at a lower price than the current one.
-
Orange (Sell Limit): Traders want to sell at a higher price than the current one.
-
Red (Sell Stop): Traders will sell if the price drops below a certain level.
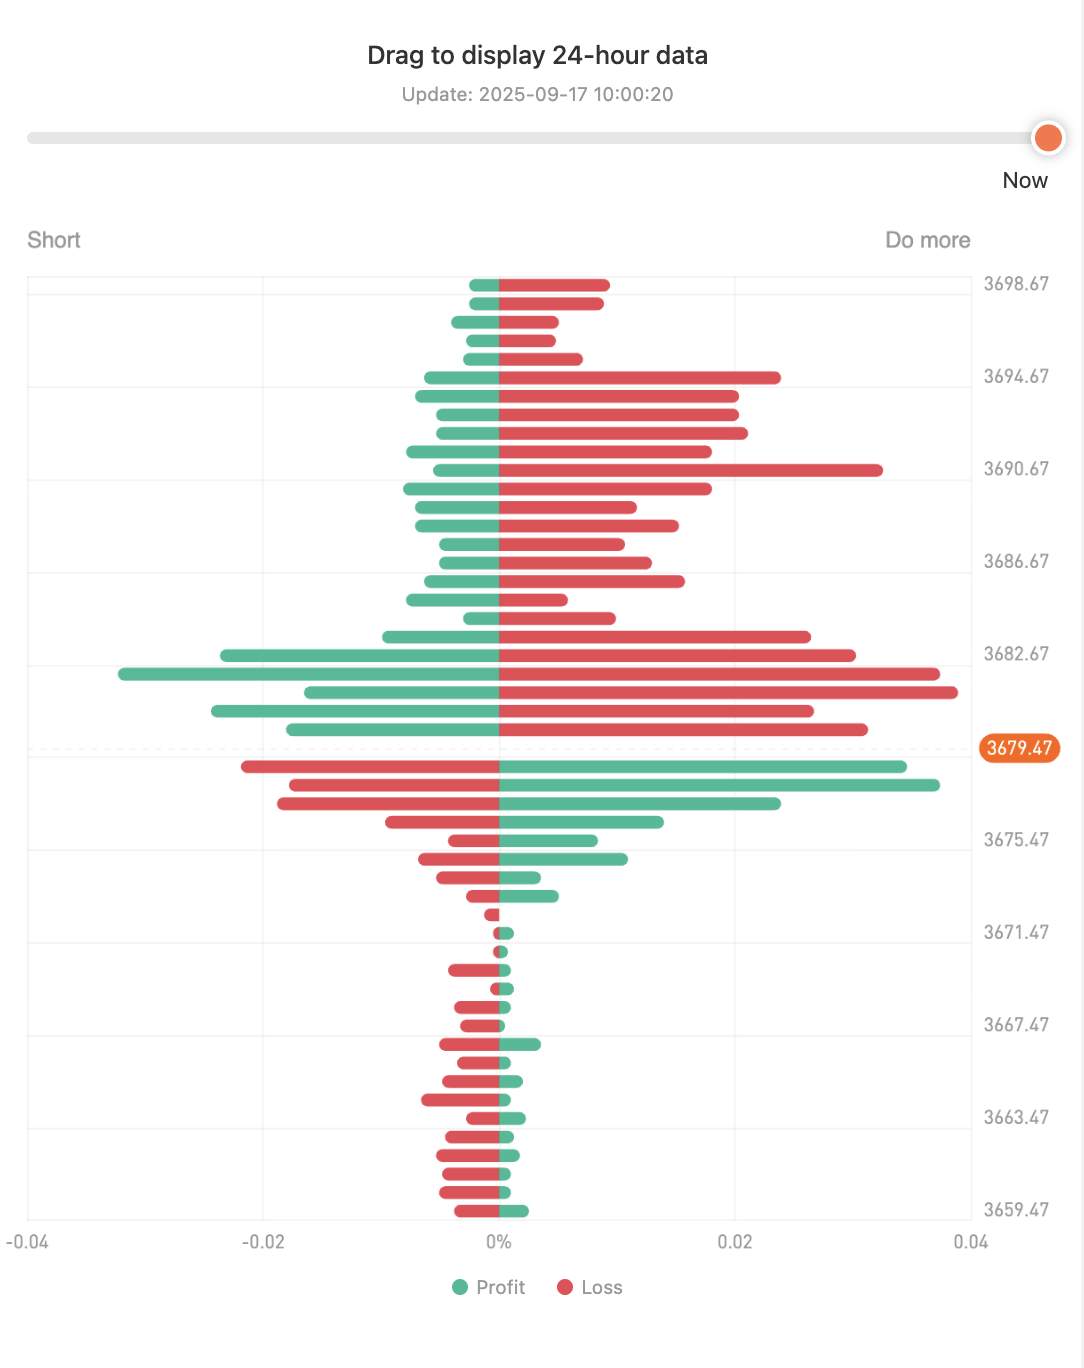
The second is Position Data, which shows where long and short positions are currently open.
-
Green indicates positions in profit.
-
Red indicates positions in loss.
How to Access It
Here’s how to find this data:
-
Click the “Market” menu.
-
Select the symbol you want to analyze (e.g., XAUUSD).
-
Click the symbol to go to the detail page.
-
Scroll down to the “Statistics” section and click “More.”
What Is the Purpose of This Data?
These charts are designed to help you:
-
Identify potential support/resistance levels based on order concentrations.
-
Spot key price levels where most traders are focused.
-
Read unexecuted buying or selling pressure (via pending orders).
-
Analyze changes in open positions over the last 24 hours.
This helps answer questions like:
-
Where are most traders placing their orders?
-
Which price levels are likely to act as support or resistance?
It’s not just a visual chart it’s a snapshot of collective market psychology.
Why Is This Data Important?
Dynamic Support and Resistance A cluster of orders at certain levels indicates potential barriers or triggers for breakouts.
Real-Time Market Sentiment See whether traders are holding longer or short positions. This gives clues about market bias.
Risk Planning Knowing where many stop-losses or limit orders are placed helps you avoid “market traps.”
How Can This Help Traders?
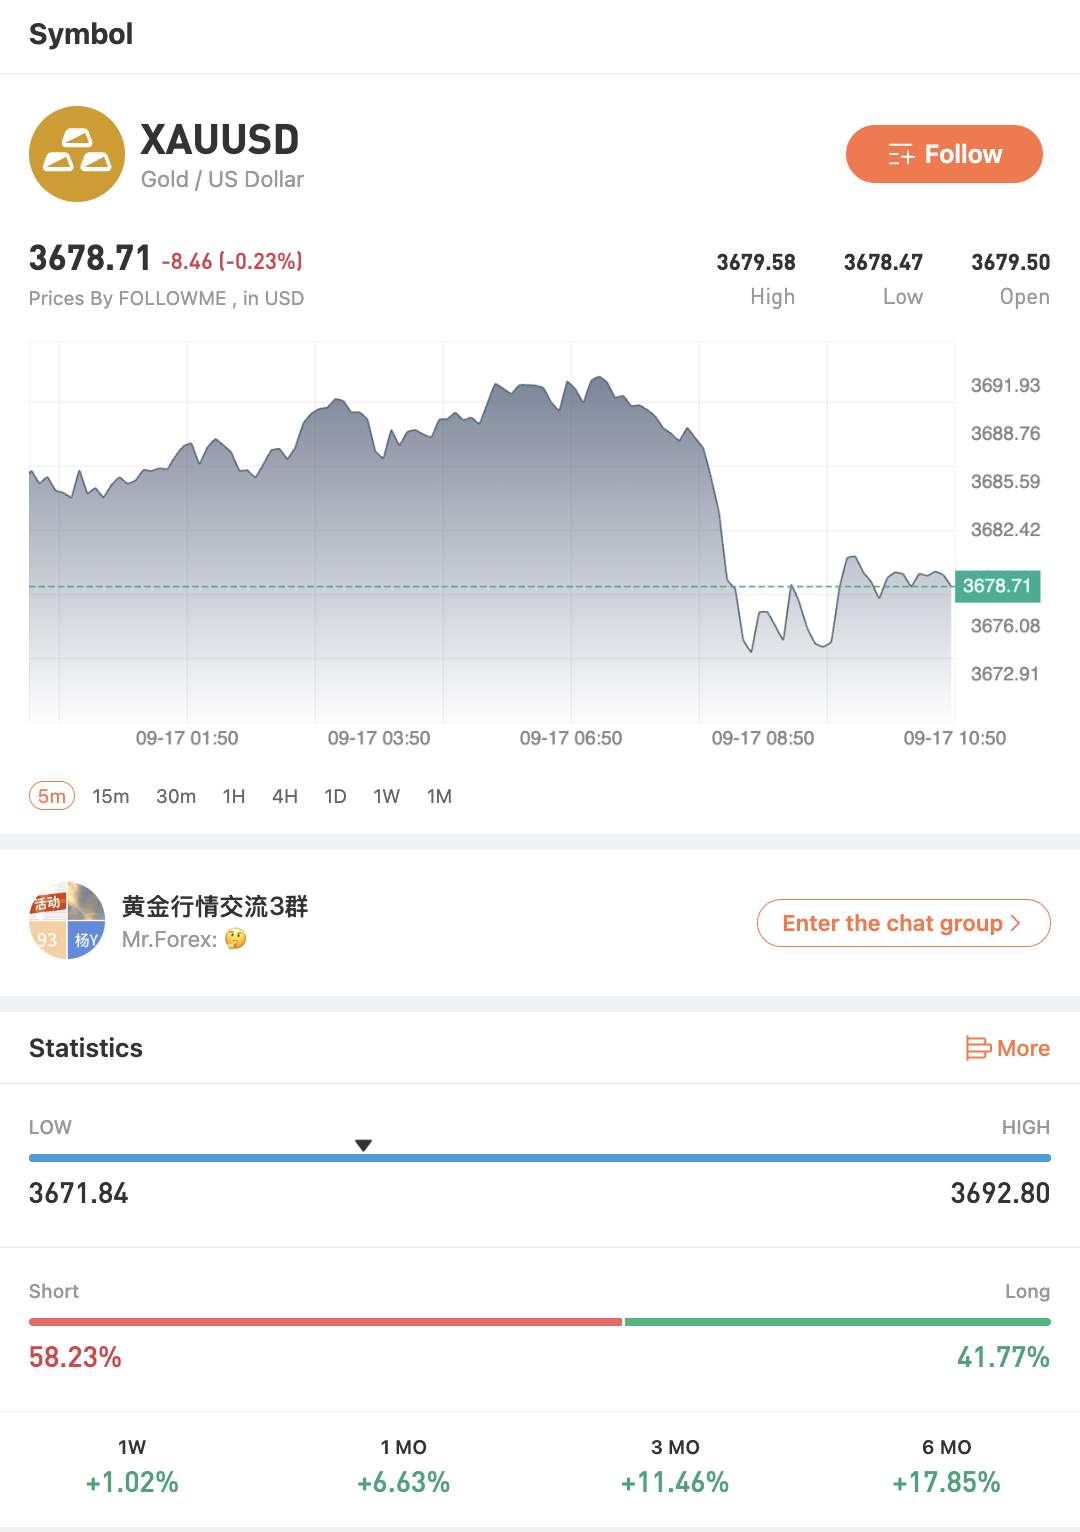
XAUUSD Chart Analysis (Gold / US Dollar)
Based on the information in the provided image, the current price of XAUUSD (Gold) is $3678.71, which is down $8.46 or 0.23% from its opening price.
How This Data Can Help Traders?
1. The Long/Short Ratio and Potential for a Bullish Momentum
The statistics show that 58.23% of traders hold short positions, significantly outnumbering those with long positions. This indicates a general market expectation for the price to fall.
However, this lopsided sentiment can create a significant opportunity for an upside move. If the price starts to recover and breaks through a key resistance level, such as the daily high of $3692.80, the large number of short positions currently in a floating loss could be "stopped out." These forced sell orders automatically turn into buy orders, creating a chain reaction that fuels a rapid surge in price, a phenomenon known as a short squeeze.
2. Using the Daily High and Low for Your Trading Strategy
The daily low of $3671.84 and high of $3692.80 can serve as critical reference points for your trading plan.
-
Support: If you see clear signs of a price rebound as it approaches the daily low of $3671.84, you might consider this a potential support level to enter a long (buy) position. You can then place your stop-loss order slightly below this level to manage risk.
-
Resistance: Conversely, if the price moves up to test the daily high of $3692.80 and shows signs of a reversal, such as strong selling pressure, you could consider this a potential resistance level to enter a short (sell) position. Your stop-loss order could be placed just above this level.
Tips for Traders
-
Combine with Price Action: Use this data together with candlestick patterns for breakout confirmation.
-
Watch Daily Changes: Pull up 24-hour data to observe how positions evolve.
-
Use as a Complement, Not the Only Tool: Best results come when combining with indicators like volume, RSI, or trend tools.
Final Thoughts
The Pending Orders and Position charts on Followme aren’t just numbers—they’re tools that reveal what the market is thinking. By reviewing these regularly, you can:
-
Identify critical price levels
-
Adjust entry/exit strategies
-
Understand market movements from the lens of trader psychology
The deeper you grasp these charts, the sharper your trading decisions will be. Knowing where traders are waiting to enter the market—and how they react to price—is the key to reading market direction with a psychological edge.
It’s not just about numbers, it’s about mass behavior that you can leverage for smarter trades.
🔔 Don’t forget to follow Followme and stay in sync with the latest updates.
风险提示:本文所述仅代表作者个人观点,不代表 Followme 的官方立场。Followme 不对内容的准确性、完整性或可靠性作出任何保证,对于基于该内容所采取的任何行为,不承担任何责任,除非另有书面明确说明。
喜欢的话,赞赏支持一下

暂无评论,立马抢沙发