Our earlier review highlighted Robinhood's (NASDAQ: HOOD) bullish five-swing structure. Currently, we are analyzing the weekly Elliott Wave pattern. This study clarifies the ongoing correction and prepares us for the next strategic phase ahead of a new bullish cycle.
Elliott Wave Analysis
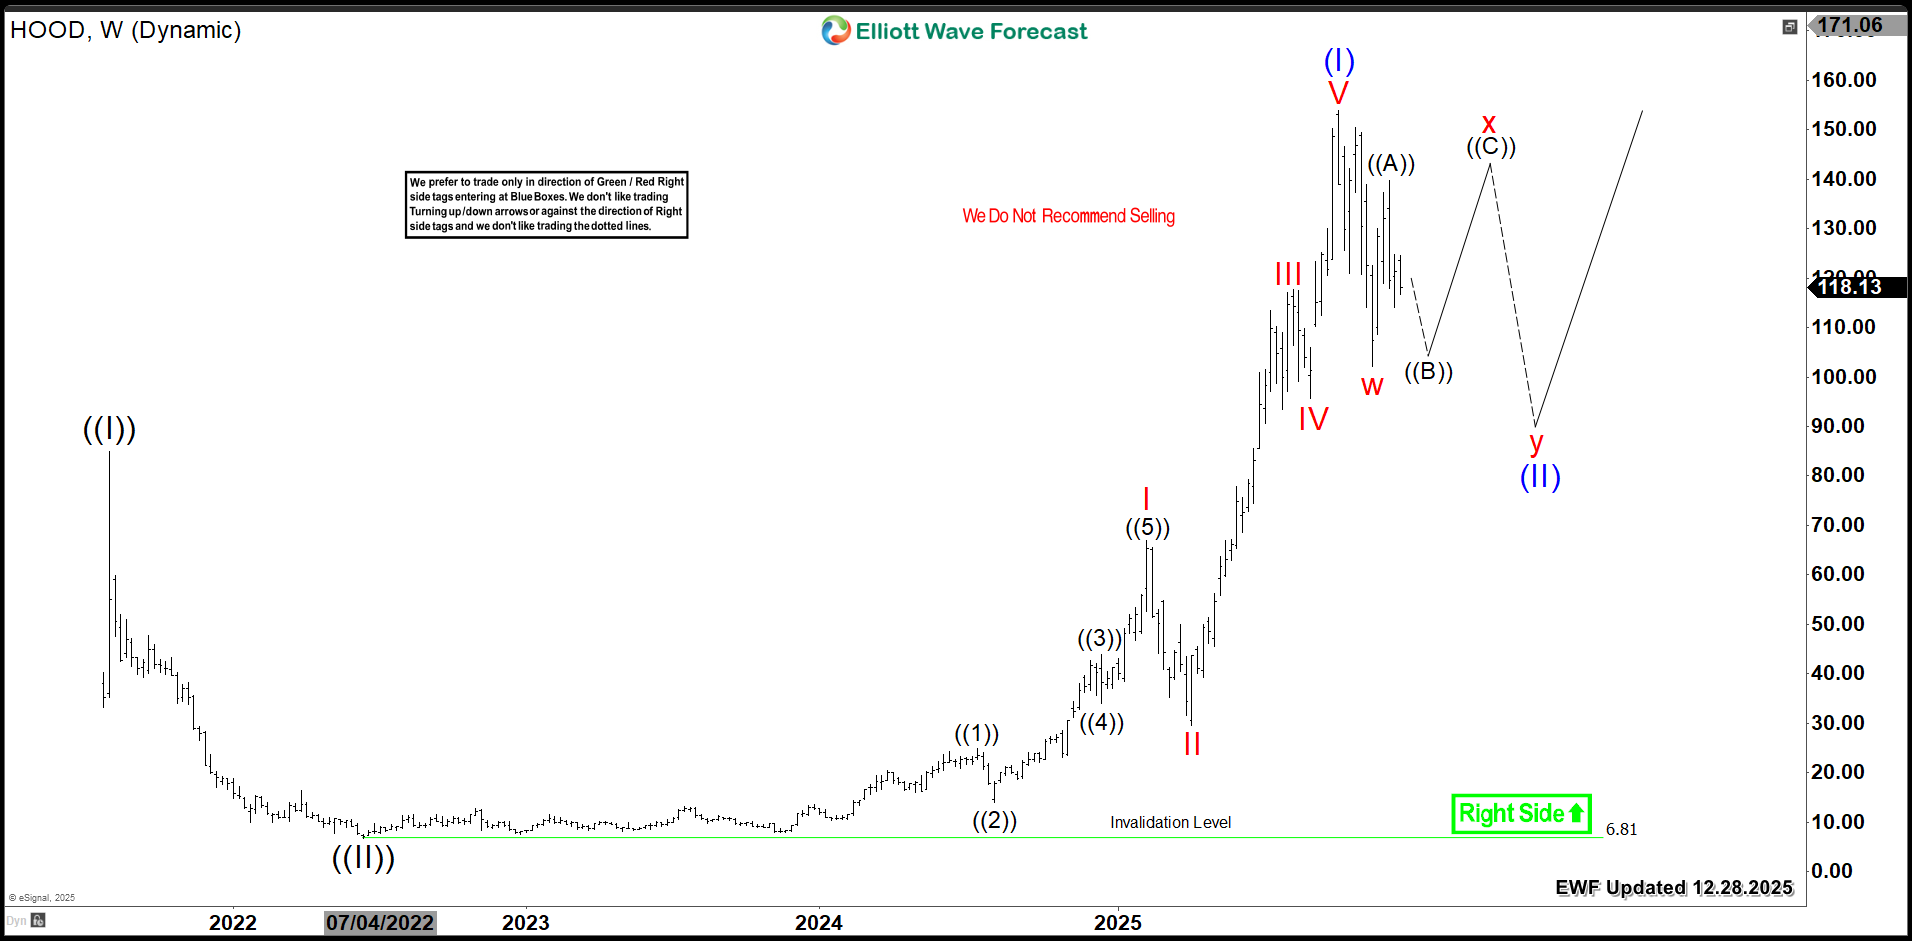
HOOD completed a five-wave advance from its 2022 low of $6.81. This rally peaked at $153.86, marking wave (I). Consequently, the stock now requires a corrective phase. This pullback will form as a 3, 7, or 11-swing pattern before the uptrend resumes.
Currently, HOOD finished the first three swings from the peak. This move ended at $102.10 as wave 'w'. Now, wave 'x' is in progress. Subsequently, wave 'y' will drive prices lower. This decline could reach the $80 - $63 Fibonacci retracement zone (50% - 61.8%).
Once wave (II) finishes, Robinhood will launch wave (III). This new cycle should become the strongest rally within the nesting structure from its all-time low.
HOOD Weekly Chart 12.28.2025
Conclusion
HOOD's weekly bullish cycle remains firmly intact. Therefore, investors should target buying opportunities within weekly pullbacks. Utilize our Elliott Wave strategy for precise entry timing. Specifically, establish positions after a 3, 7, or 11-swing correction completes. Additionally, our proprietary Blue Box system pinpoints high-probability entry zones. Consequently, this disciplined method provides clarity and confidence. Ultimately, it positions traders to capture the next major bullish leg.
风险提示:本文所述仅代表作者个人观点,不代表 Followme 的官方立场。Followme 不对内容的准确性、完整性或可靠性作出任何保证,对于基于该内容所采取的任何行为,不承担任何责任,除非另有书面明确说明。

暂无评论,立马抢沙发