As a bellwether industrial stock, Caterpillar often reflects the underlying strength of the economy and signals long-term market positioning. Its price behavior tends to lead broader market trends, offering insight into structural phases rather than short-term fluctuations. Viewed through this lens, $CAT’s current action suggests stability and leadership, supporting the idea that the $SPX is not topping but instead forming a durable base for a higher long-term move.
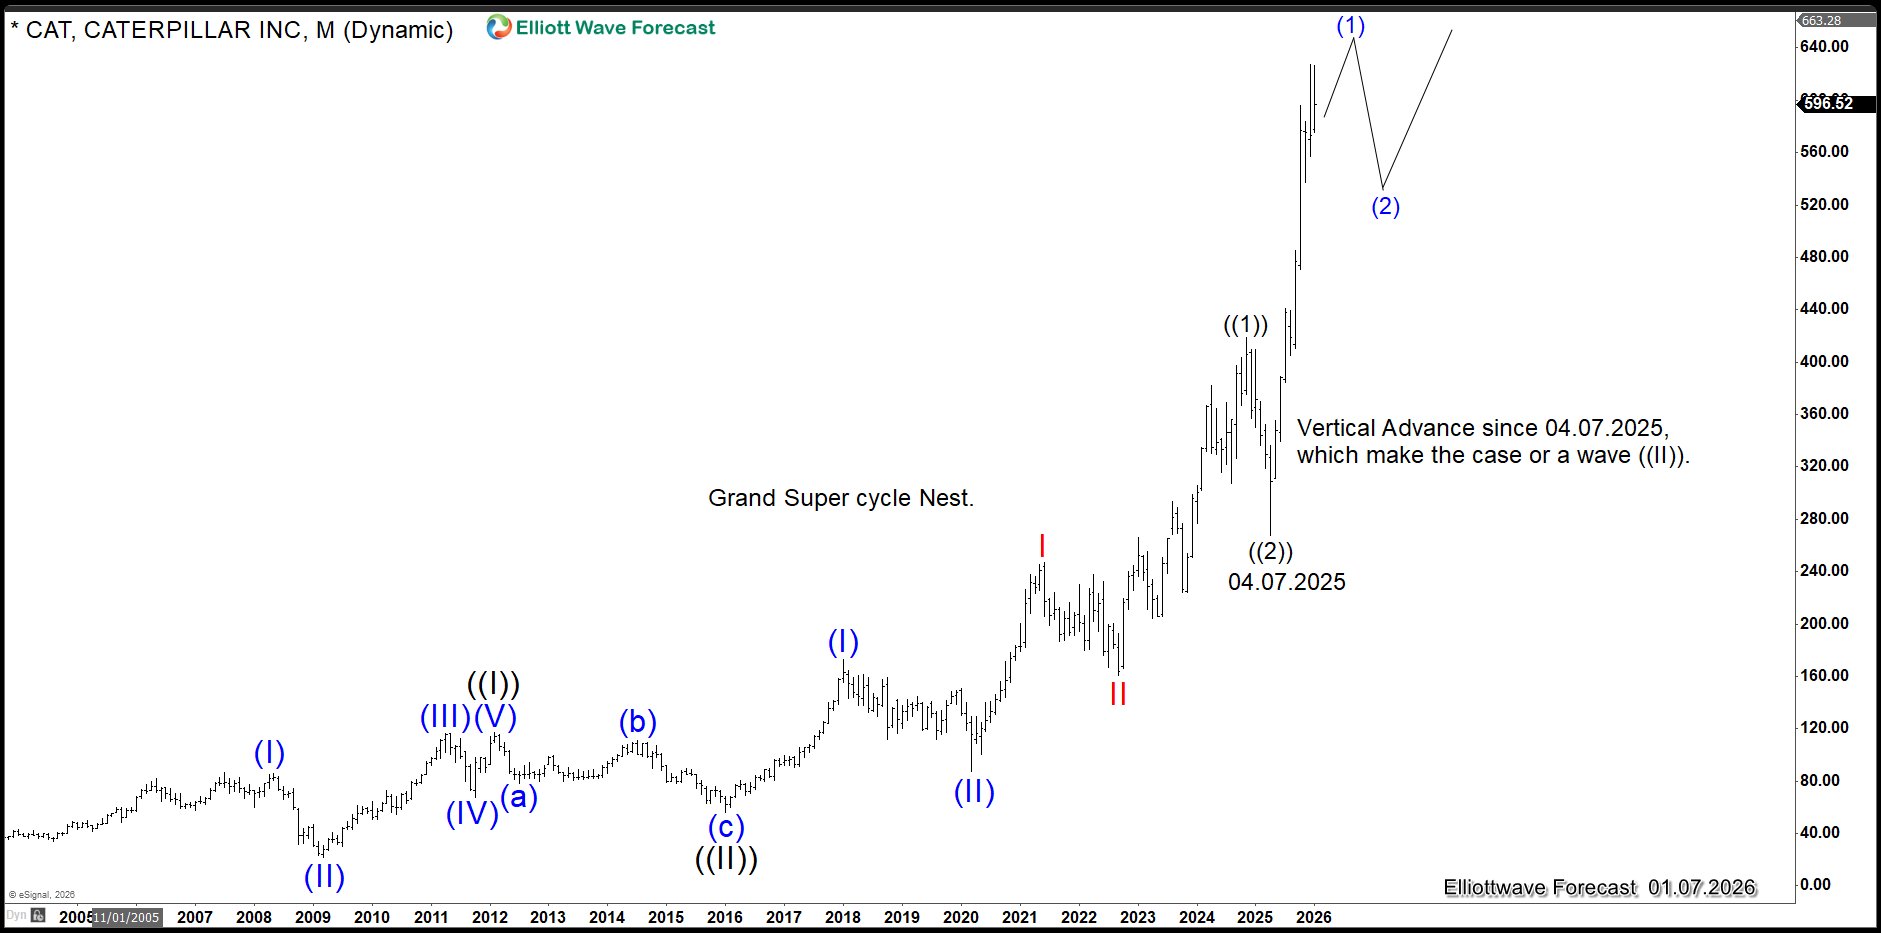
Within our Elliott Wave Theory framework, Caterpillar ($CAT) is entering, or may already be within wave ((II)). Wave ((III)) is historically recognized for its strength and vertical price action, occurring when market participants broadly align on one side of the market. Pullbacks in this phase are often regarded as profit-taking rather than genuine reversals. In our system, the most powerful wave ((III)) advances frequently begin after a sequence of smaller-degree 1–2 formations, a structure we call a nest.
Here is a nest in the Elliott Wave Theory:
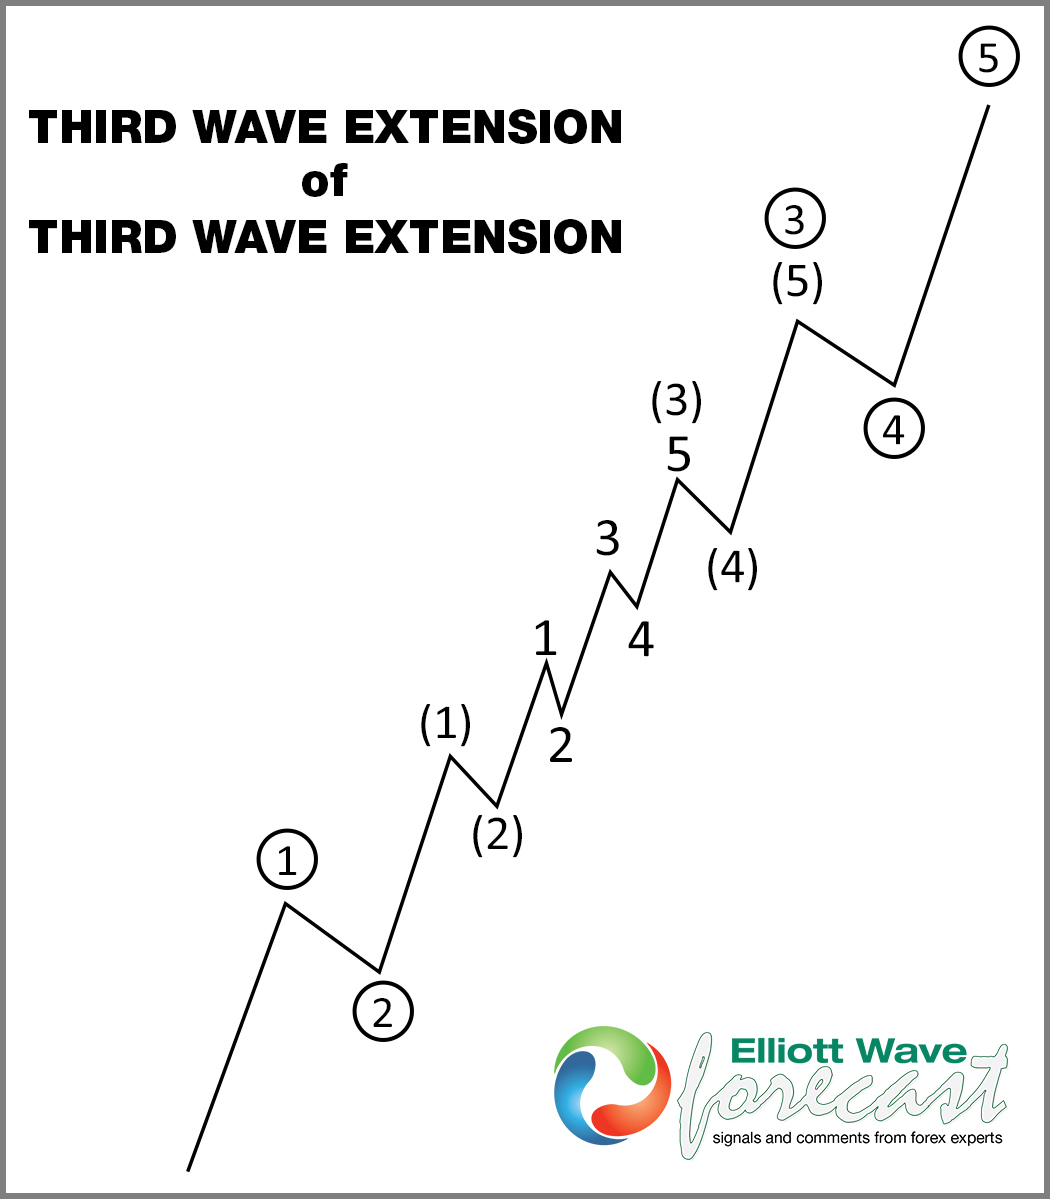
A nest is a complex arrangement that often confuses traders. It can appear to complete a five-wave move, leading many to expect a correction, when in fact it represents higher-degree setups preparing the market for extension. Caterpillar is currently nesting within the Grand Super Cycle and continues to show strong upside momentum. Since 04.07.2025, the stock has moved vertically, suggesting either that wave ((3)) is already underway or that another nest in wave (1) is forming ahead of wave ((3)). In either case, the message is clear: Caterpillar remains very bullish, with upside targets in the $800–$900 region.
Monthly Elliott Wave Chart of Caterpillar (CAT)
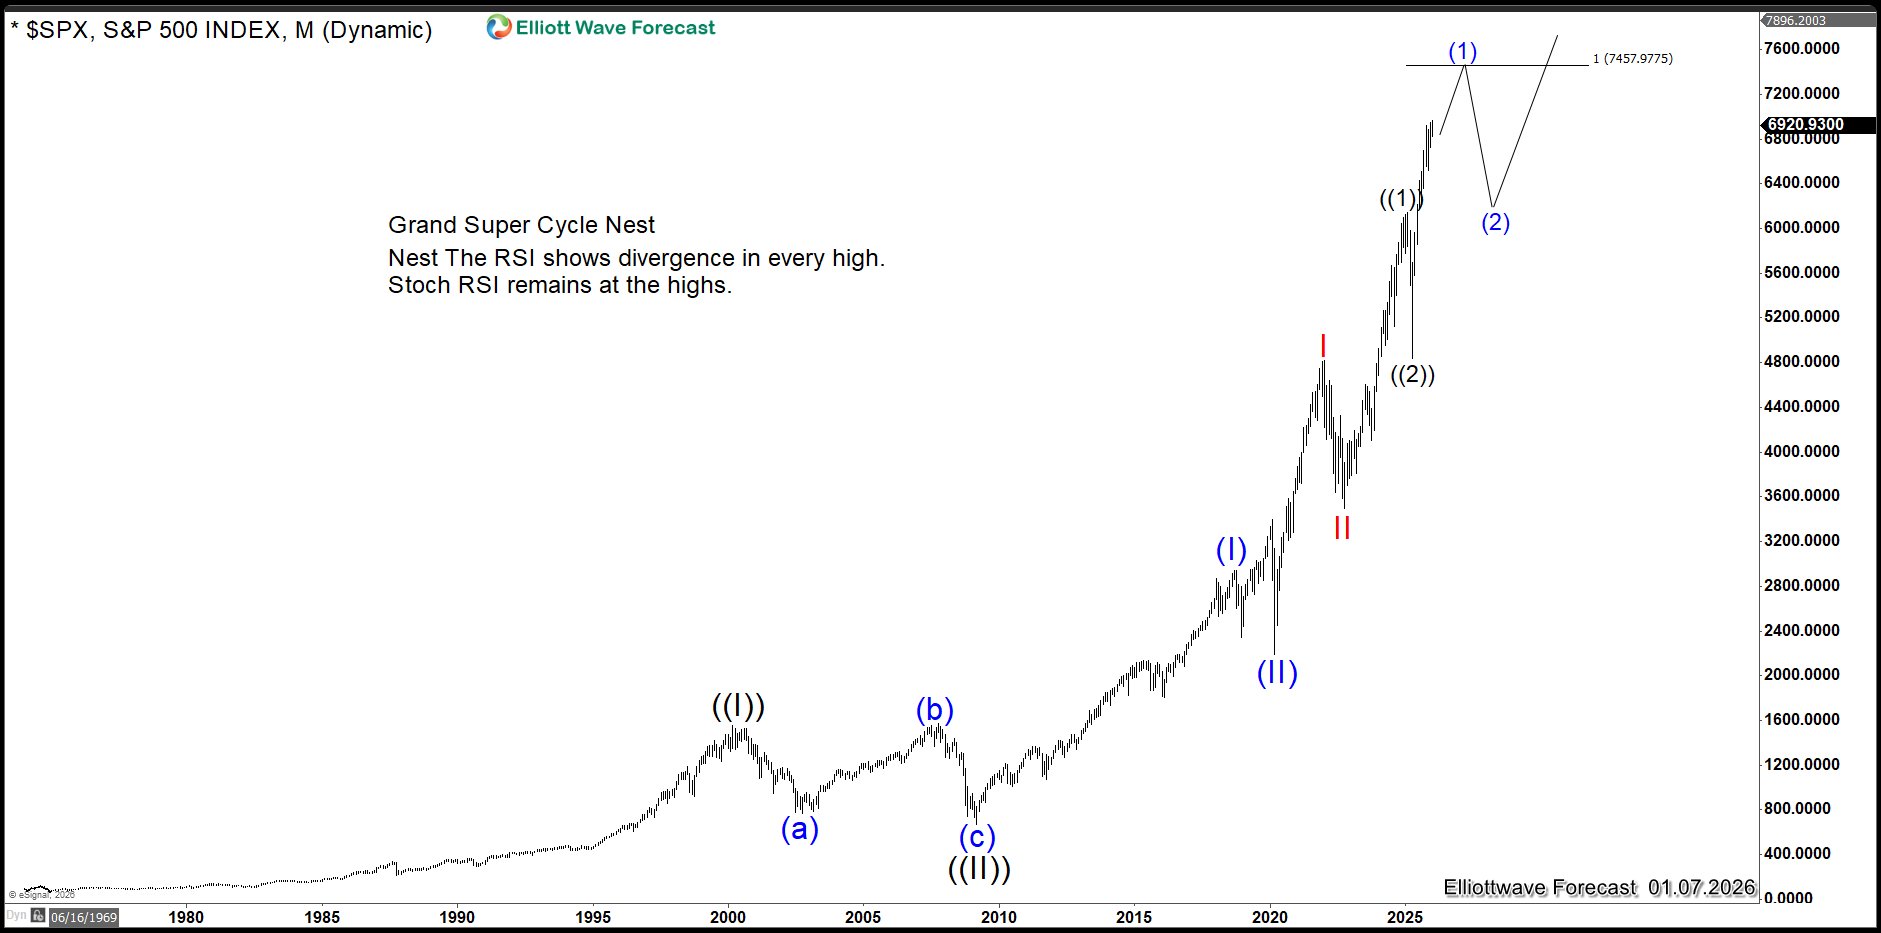
The $SPX chart below shows a similar nest structure, which appears to be ending wave (1) since 04.07.2026. This alignment with $CAT supports the view that both are operating within a powerful wave ((3)). The $10,000 level is the minimum target, but projections extend toward $12,000. Many traders remain skeptical of such levels, yet we have consistently emphasized the validity of the nest and its implications.
Monthly Elliott Wave Chart of S&P 500 (SPX)
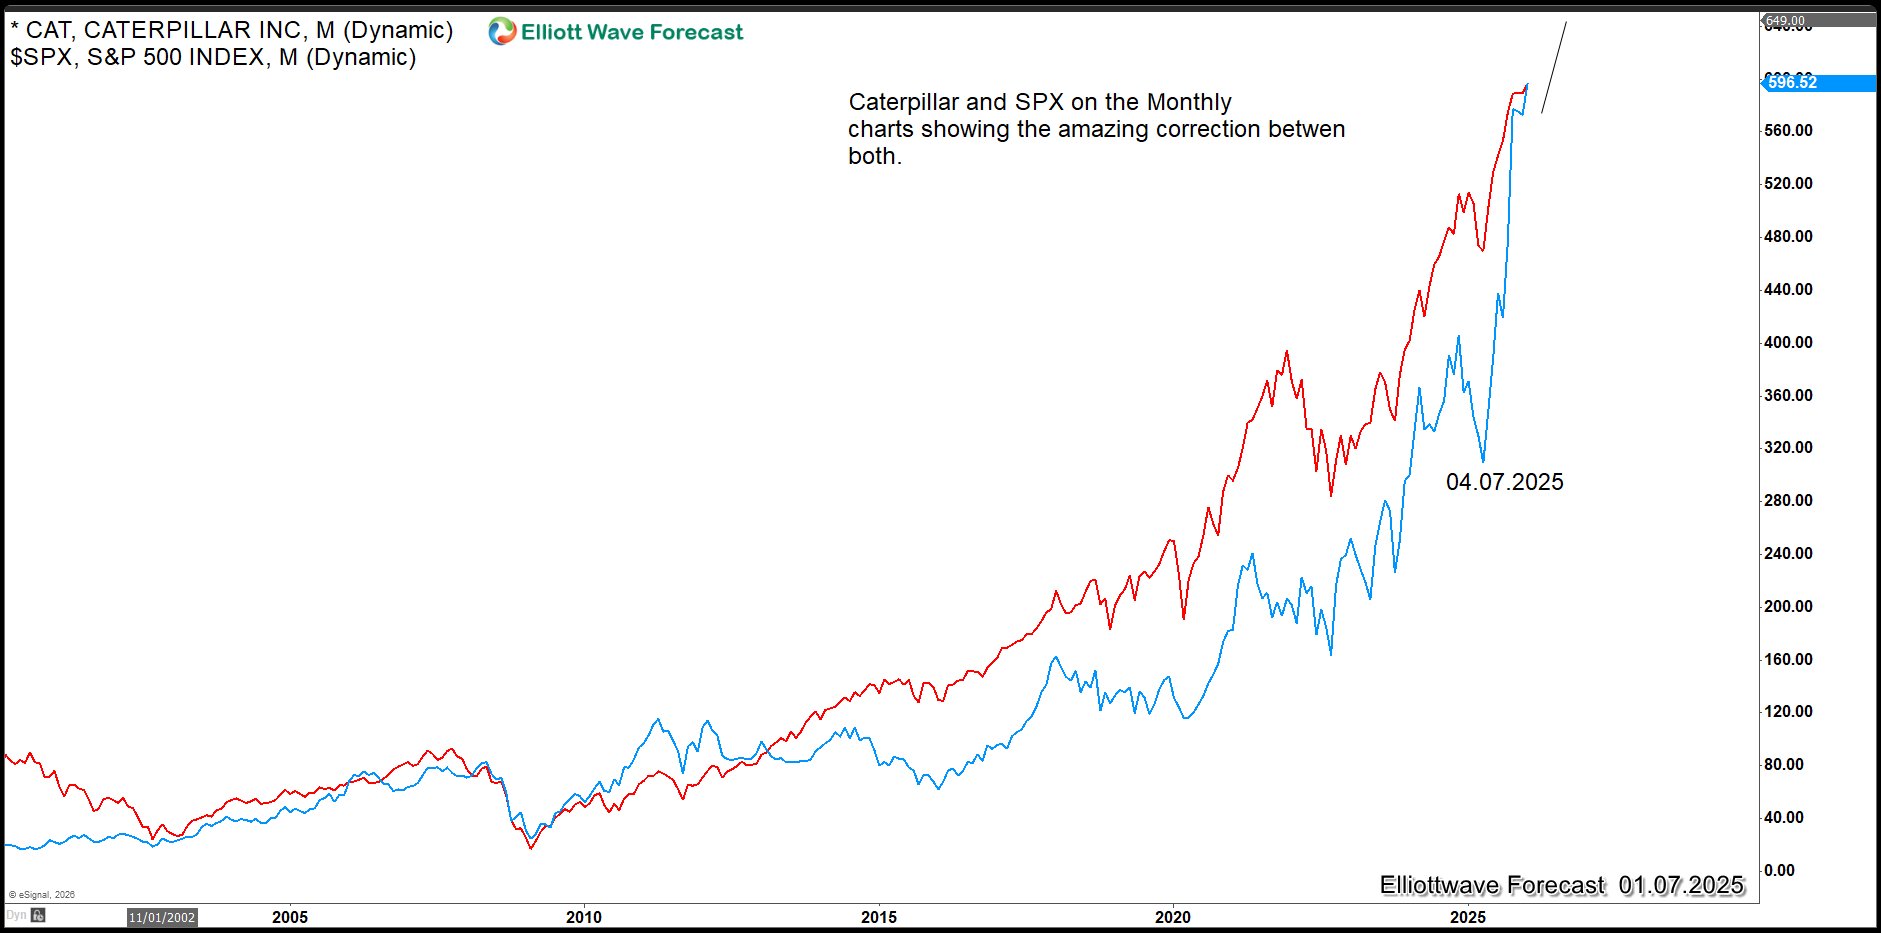
Another chart compares $SPX and $CAT directly, highlighting the strong correlation between the two symbols.
At EWF, we have repeatedly stated that indices remain well supported and that a nest into wave ((3)) is a real possibility despite widespread doubt. In a recent seminar, available here, we explain this quadruple nest structure in detail. We follow our system with discipline, deliberately avoiding market noise, and trust our methodology. While only time will confirm the outcome, Caterpillar’s price action continues to reinforce our view. It strengthens he case that a move in the $SPX toward 10,000 could occur much sooner than many expect.
风险提示:本文所述仅代表作者个人观点,不代表 Followme 的官方立场。Followme 不对内容的准确性、完整性或可靠性作出任何保证,对于基于该内容所采取的任何行为,不承担任何责任,除非另有书面明确说明。

暂无评论,立马抢沙发