Raytheon Technologies Corp (NYSE: RTX) leads the aerospace and defense sector. Recent geopolitical events have fueled strong outperformance and momentum for the stock. Today, we analyze the Elliott Wave pattern driving its strategic breakout. Our examination provides a clear technical roadmap for its ascent. This convergence of sector strength and wave structure creates a compelling technical setup.
Elliott Wave Analysis
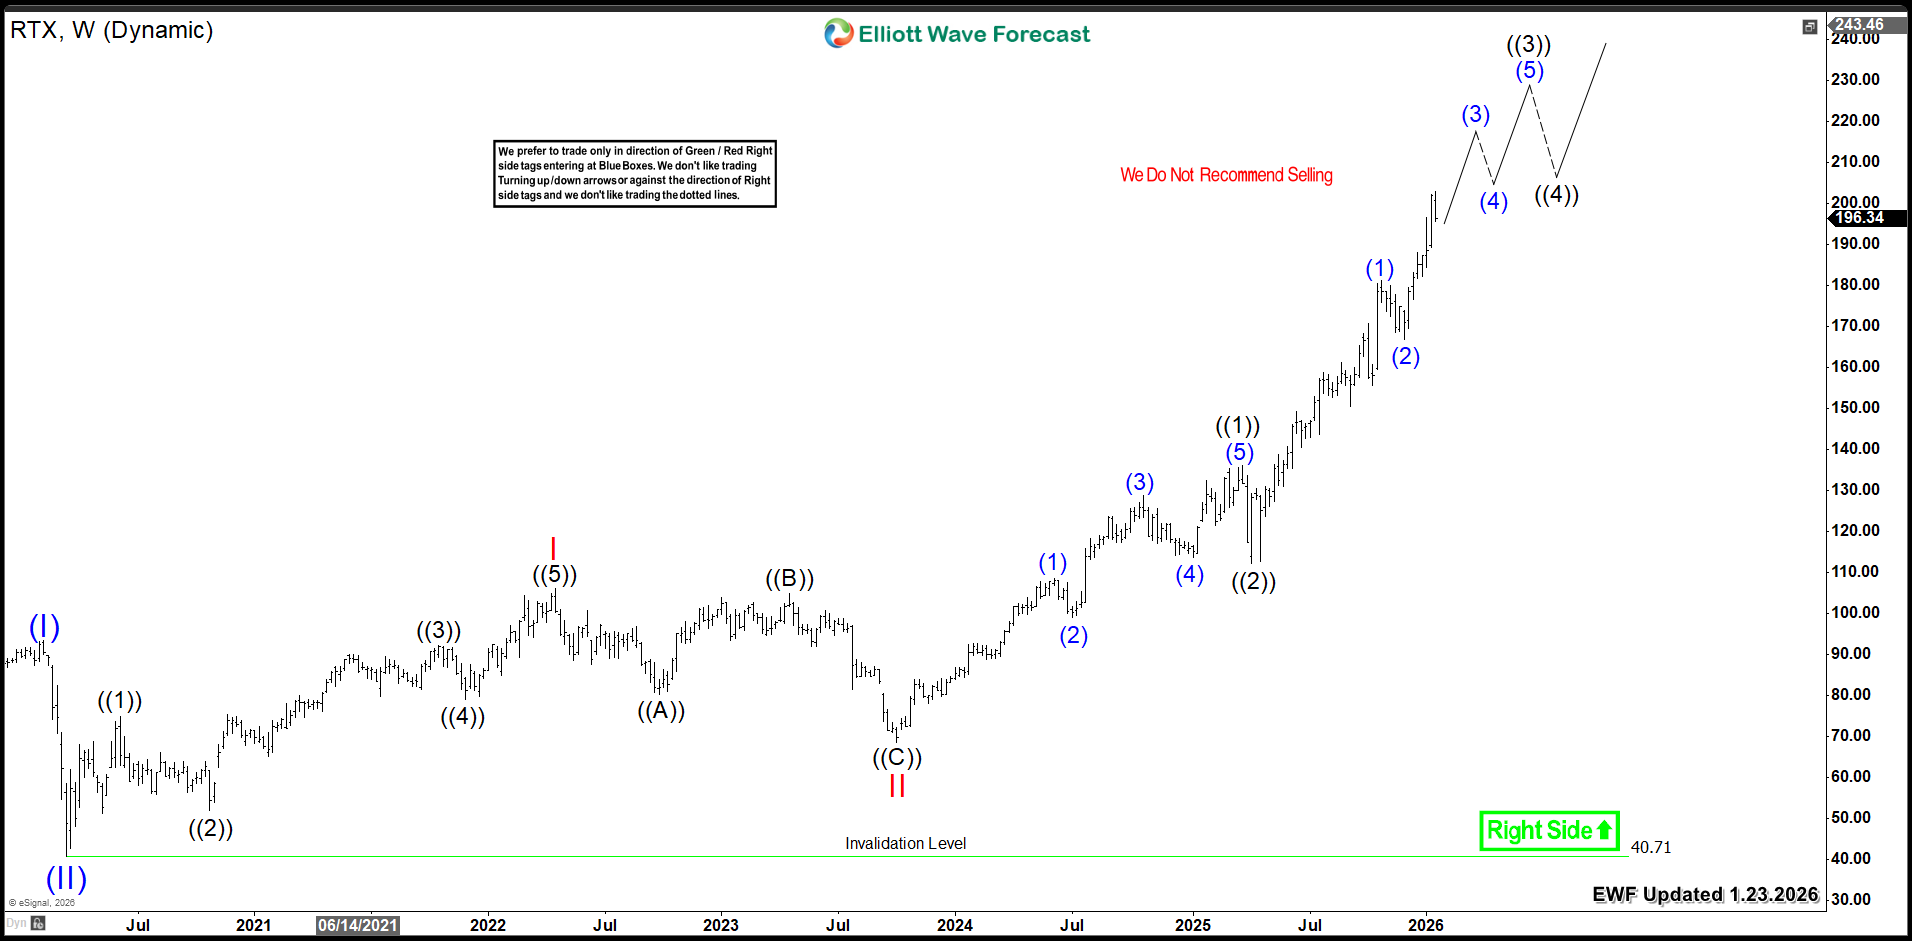
From its 2020 low, RTX created a three-wave advance to new highs. Wave I ended at $106, followed by Wave II at $68. Currently, Wave III remains in progress. This weekly cycle also shows three waves into new highs. Therefore, the stock has an incomplete bullish sequence. It aims to complete five-wave advances from both 2020 and 2023.
The projected path shows an extension toward $222. This move will likely occur within wave ((3)). Consequently, it can later propel Wave III beyond $250.
RTX should continue extending higher through a series of third and fourth waves. The key invalidation level is the April 2025 low of $112. All daily corrections must hold above this level. These pullbacks will create buying opportunities as 3, 7, or 11-swing patterns.
RTX Weekly Chart 1.23.2026
Conclusion
RTX's bullish cycle confirms further upside ahead. Consequently, traders should target strategic entries during daily pullbacks. Apply our Elliott Wave methodology for exact timing. Specifically, enter the market after a 3, 7, or 11-swing correction completes. Additionally, our proprietary Blue Box system identifies high-probability reversal zones. This disciplined approach provides clarity and confidence. Ultimately, it positions you to capture the next major advance.
风险提示:本文所述仅代表作者个人观点,不代表 Followme 的官方立场。Followme 不对内容的准确性、完整性或可靠性作出任何保证,对于基于该内容所采取的任何行为,不承担任何责任,除非另有书面明确说明。

暂无评论,立马抢沙发