Royal Caribbean Cruises Ltd (NYSE: RCL) is a global cruise industry leader. This article analyzes its weekly Elliott Wave structure. Our examination uncovers the current bullish path and key targets ahead of the next correction.
Elliott Wave Analysis
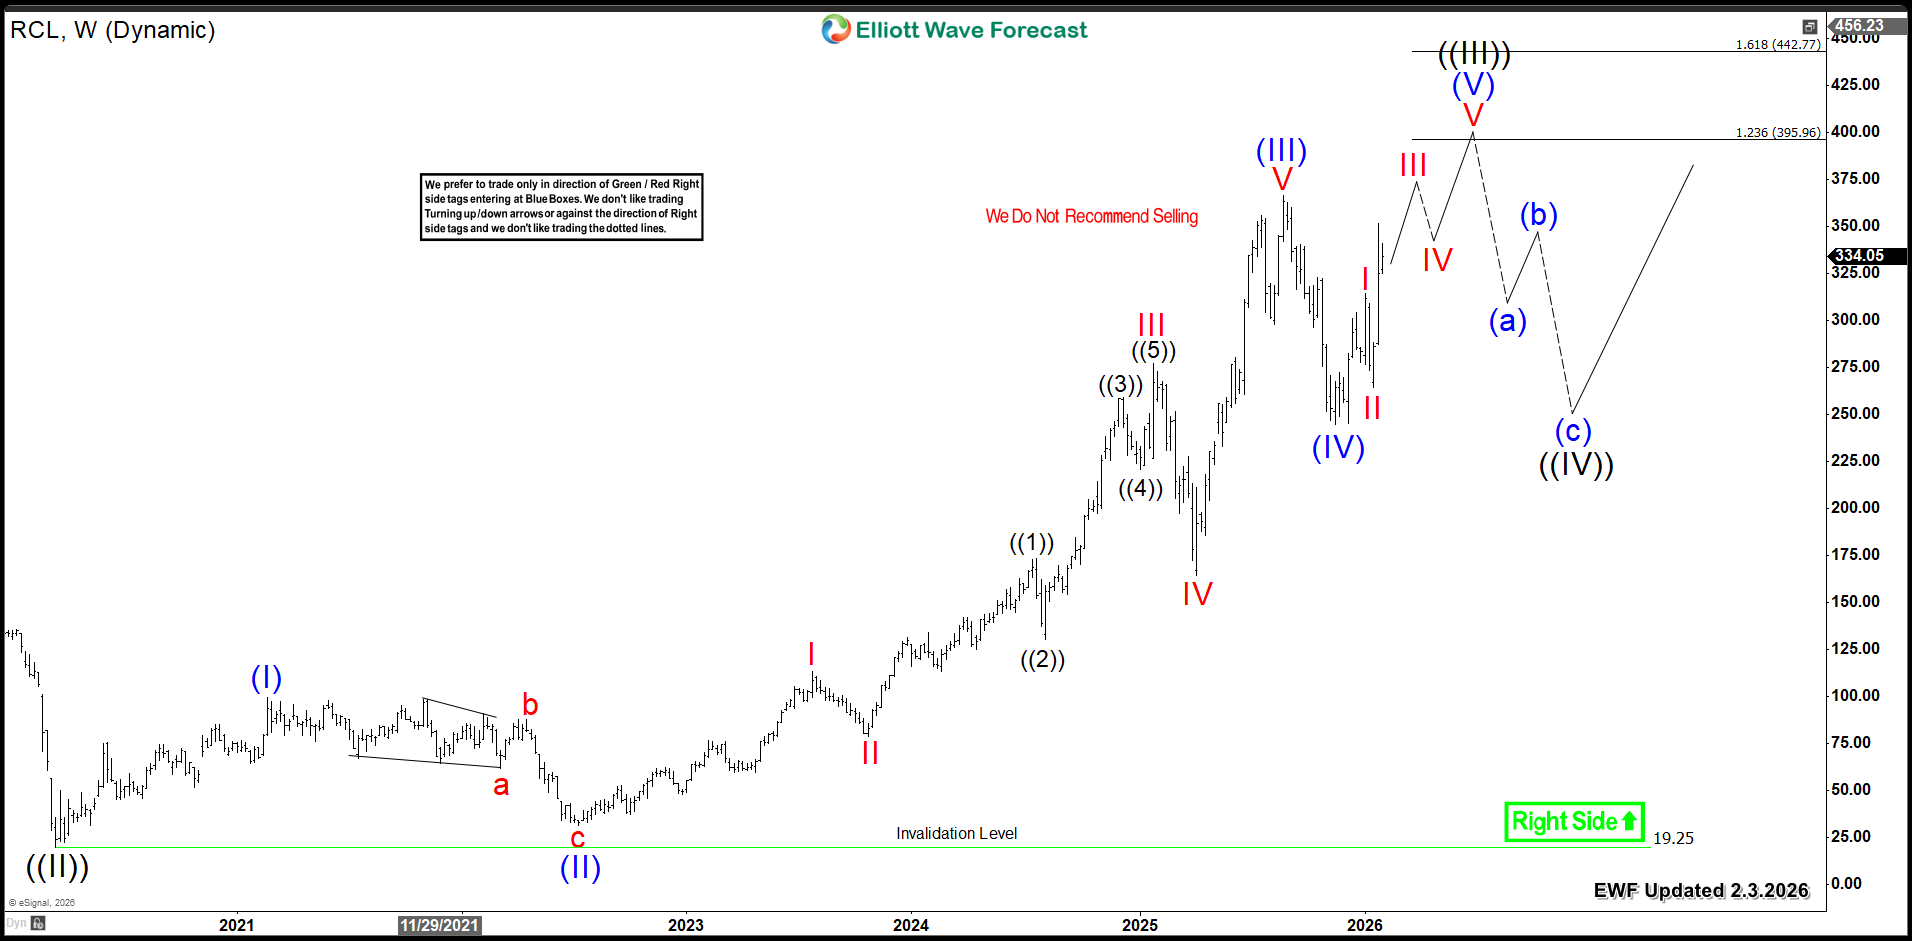
From its 2020 low, RCL created a three-wave advance into new highs. Wave (I) ended at $99.24. Then, Wave ((2)) corrected to $31.09. Next, Wave (III) reached $336.50, and Wave (IV) finished at $244.45. Currently, the stock resumes its rally in Wave (V) of ((III)), targeting new highs.
The projected path shows an upside target of $395 - $442. Therefore, price must stay above the January 2026 low of $264. This level is essential for continuing the impulsive advance.
Wave (V) could extend beyond the regular target this year. However, once Wave ((III)) completes, a larger Wave ((IV)) correction will begin. This pullback will then present the next strategic investment opportunity.
RCL Weekly Chart 2.3.2026
Conclusion
RCL's bullish cycle indicates further upside ahead. Consequently, traders should target strategic entries during corrective pullbacks. Implement our Elliott Wave methodology for precise timing. Specifically, enter the market after a 3, 7, or 11-swing correction completes. Additionally, our proprietary Blue Box system identifies high-probability reversal zones. This disciplined approach provides clarity and confidence. Ultimately, it positions you to capture the next major advance.
风险提示:本文所述仅代表作者个人观点,不代表 Followme 的官方立场。Followme 不对内容的准确性、完整性或可靠性作出任何保证,对于基于该内容所采取的任何行为,不承担任何责任,除非另有书面明确说明。

暂无评论,立马抢沙发