The Global X Silver Miners ETF (SIL) provides investors with diversified exposure to leading silver mining companies across the globe. Since its launch in 2010, the fund has tracked the Solactive Global Silver Miners Total Return Index, offering a straightforward way to participate in the sector through a single trade. In the discussion that follows, we examine the ETF’s Elliott Wave technical outlook.
SIL (Silver Miners ETF) Monthly Elliott Wave Chart
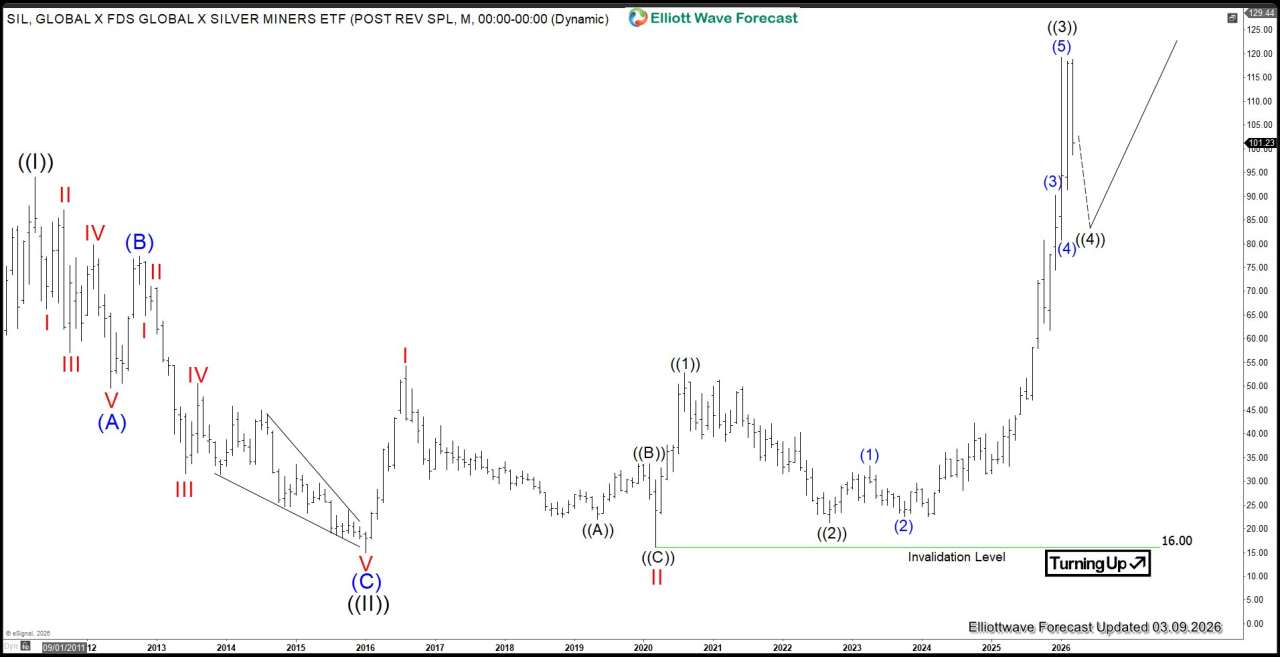
The monthly Elliott Wave chart of the Silver Miners ETF (SIL) suggests the ETF is nesting higher after completing the wave ((II)) pullback at $14.94. From that low, wave I advanced to $54.34, followed by a wave II correction down to $16. The ETF then nested higher, with wave ((1)) peaking at $52.87 and wave ((2)) retracing to $21.26.
Subsequently, wave ((3)) is proposed complete at $119.24, and the current wave ((4)) pullback is unfolding to correct the cycle from the September 2022 low before resuming higher. As long as the $16 pivot remains intact, SIL is expected to attract buyers and extend the bullish sequence.
Silver Miners ETF Daily Elliott Wave Chart
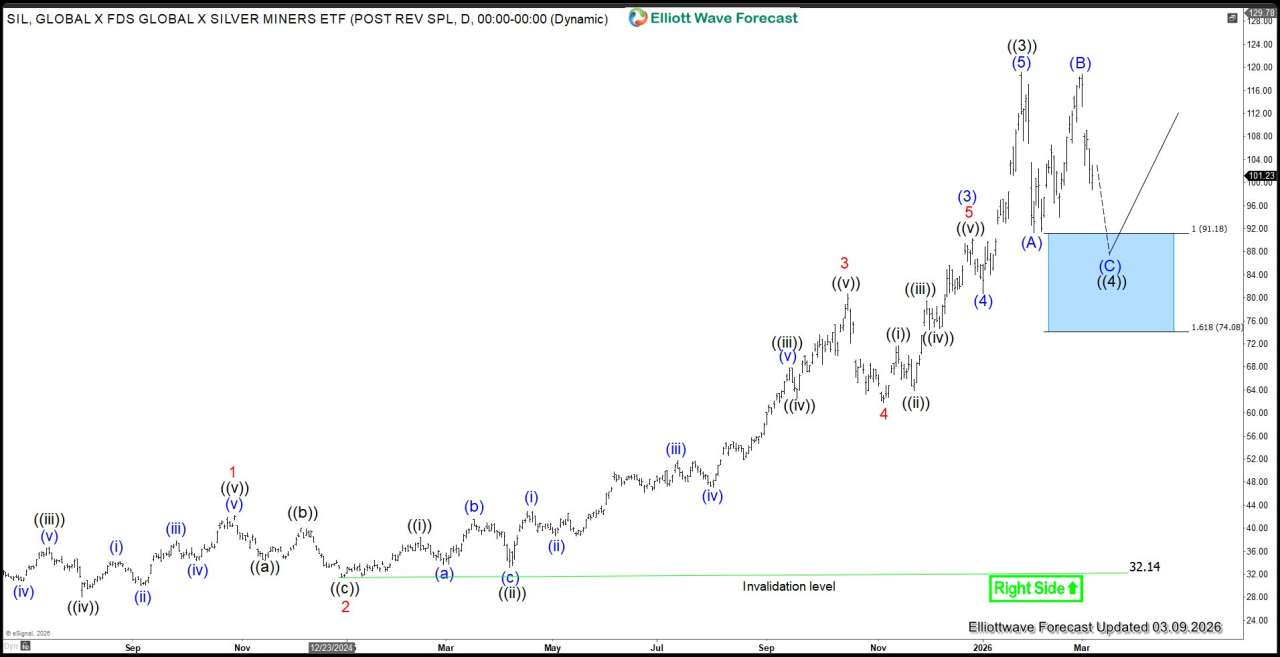
The daily Elliott Wave chart of the Silver Miners ETF (SIL) indicates that the rally to $119.24 completed wave ((3)). The ETF is now correcting the cycle from the September 2022 low in wave ((4)). The pullback is unfolding as a zigzag structure, with wave (A) ending at $91.31 and wave (B) at $118.85. Currently, wave (C) is progressing lower toward the inflection zone of $74–$91.10. Wave ((4)) is expected to complete at this area before the broader uptrend resumes.
风险提示:本文所述仅代表作者个人观点,不代表 Followme 的官方立场。Followme 不对内容的准确性、完整性或可靠性作出任何保证,对于基于该内容所采取的任何行为,不承担任何责任,除非另有书面明确说明。

暂无评论,立马抢沙发