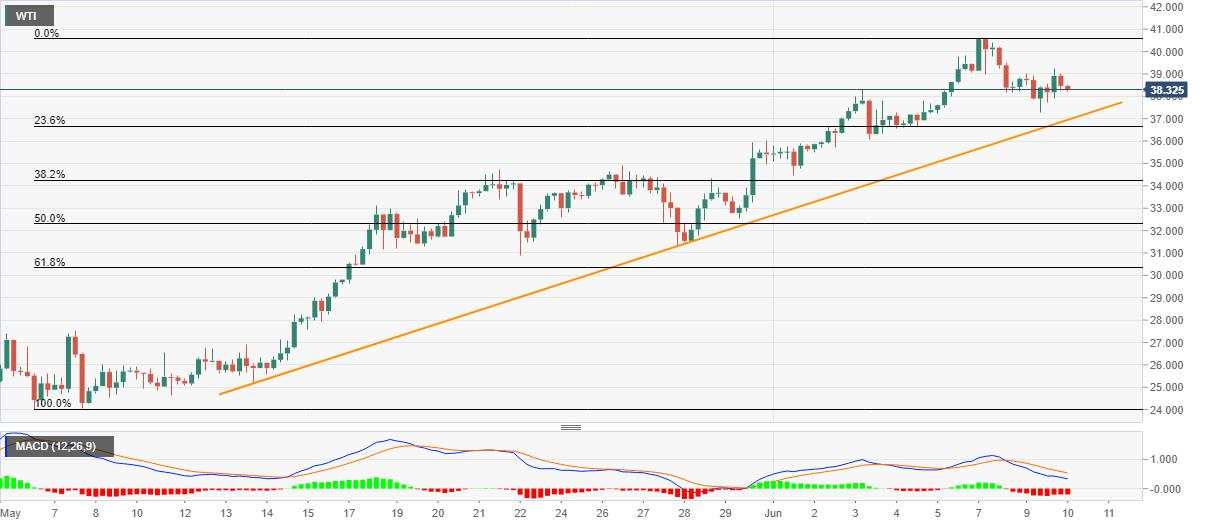
- WTI benchmark snaps the previous day’s recovery moves from $37.26.
- Bearish MACD signals drag the quote towards an ascending trend line from May 13.
- Buyers may look for a sustained break above $40.00 for fresh entries.
WTI crude oil prices on NYMEX decline to $38.27 during the initial Asian session on Wednesday. The barrels of black gold recovered from $37.26 on Tuesday but failed to rise past-$38.55 on the daily closing basis.
Other than the energy benchmark’s failure to cross $38.55, bearish MACD also favors the odds of further downside towards the monthly support near $36.95.
Should the bears refrain from respecting the short-term key support line, May 26 high near $34.90 could offer intermediate halt ahead fetching the quote to sub-$31.00 area.
Meanwhile, $40.00 round-figure and the weekly high near $40.61 might keep the bulls away during the pair’s U-turn towards the north. Given the commodity prices rally past-$40.61, March 06 low near $41.22 could lure the bulls.
WTI four-hour chart
Trend: Further downside likely
作者:Anil Panchal,文章来源FXStreet,版权归原作者所有,如有侵权请联系本人删除。
风险提示:本文所述仅代表作者个人观点,不代表 Followme 的官方立场。Followme 不对内容的准确性、完整性或可靠性作出任何保证,对于基于该内容所采取的任何行为,不承担任何责任,除非另有书面明确说明。

暂无评论,立马抢沙发