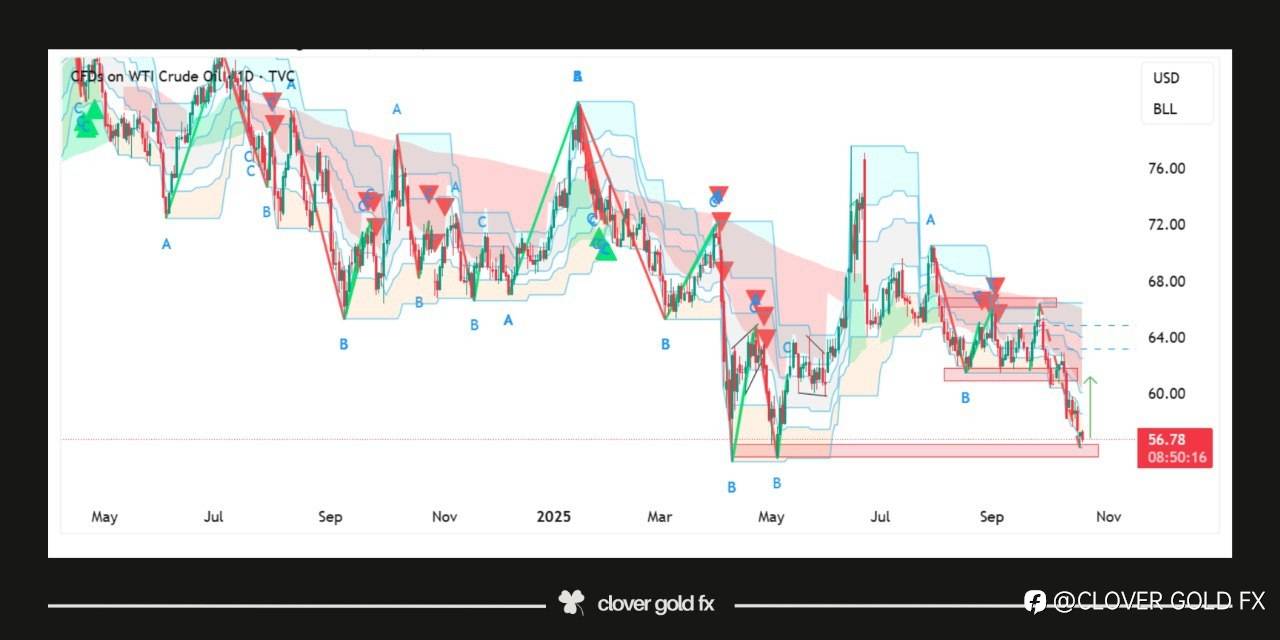
#usoil
The daily chart of US Oil shows a clear technical structure indicating potential bullish momentum ahead. After an extended downtrend the market has formed a triple bottom pattern which often signals exhaustion of selling pressure and a possible reversal. The appearance of a bullish hammer at this key support zone further strengthens the idea that buyers are stepping in to defend the area. Following the earlier range breakout and rejection from horizontal resistance the price has now returned to a major demand region where previous reactions have occurred. This combination of patterns suggests that the market could soon experience upward movement as sentiment shifts from bearish to bullish with traders watching closely for confirmation of continued strength in the coming sessions.
风险提示:本文所述仅代表作者个人观点,不代表 Followme 的官方立场。Followme 不对内容的准确性、完整性或可靠性作出任何保证,对于基于该内容所采取的任何行为,不承担任何责任,除非另有书面明确说明。


加载失败()