注册
登录
忘记密码
热门
发现信号
交易大赛
社区之星
市场
创作者
隐私政策
服务条款
帮助中心
联系我们
品牌专页
免责声明
更多...
© 2026 Followme
CLOVER GOLD FX
63 粉丝
·
9 关注
于
2025年01月23日 加入
关注
帖子
简介
CLOVER GOLD FX
02月08日
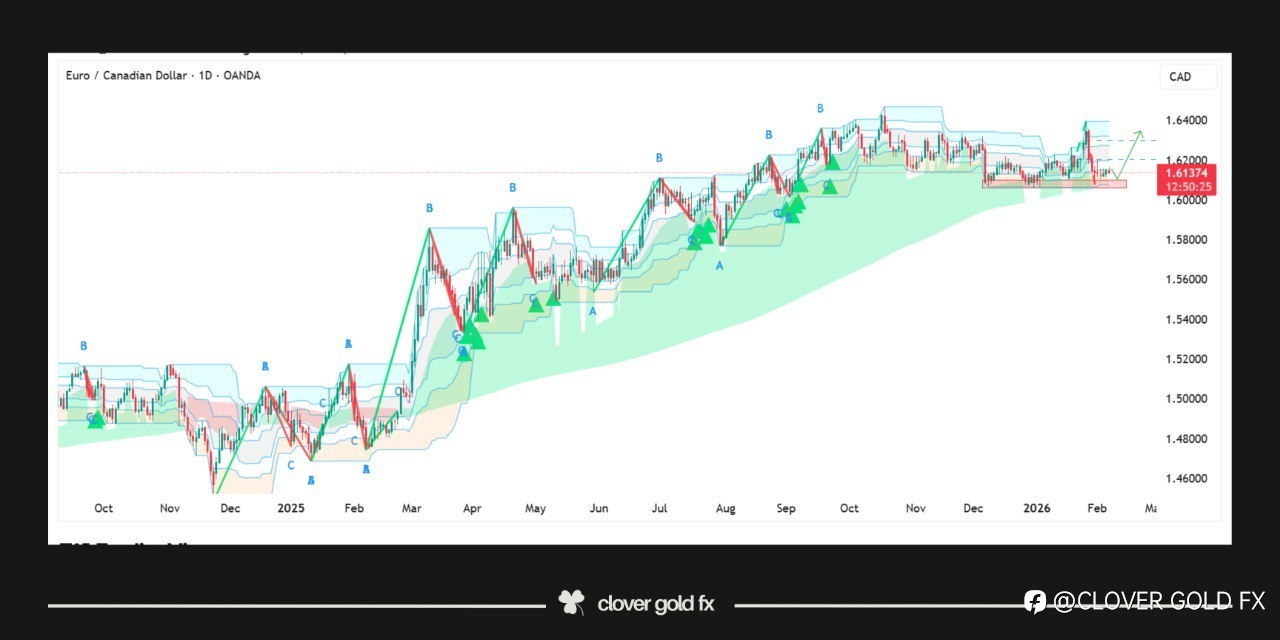
EURCAD is trading within a corrective structure after completing a clear impulsive advance and the recent decline has found strong demand at a well-defined support zone which has already been respecte...
展开
CLOVER GOLD FX
02月08日
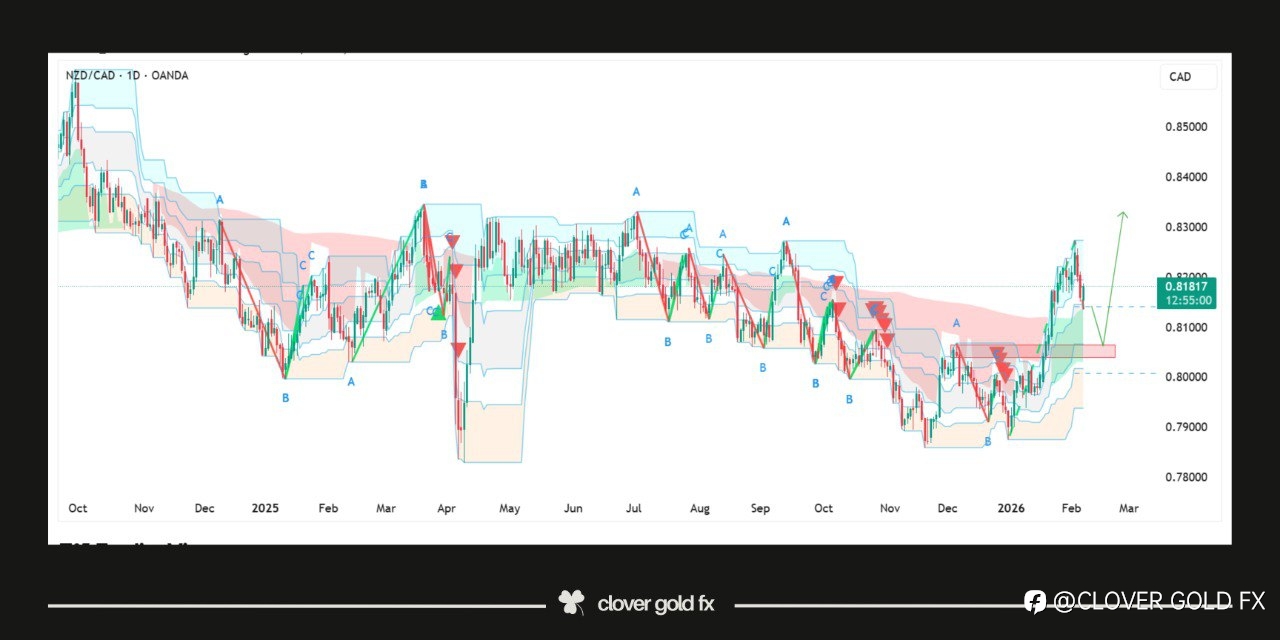
#nzdcad #forex #forextrader #trading
CLOVER GOLD FX
02月08日
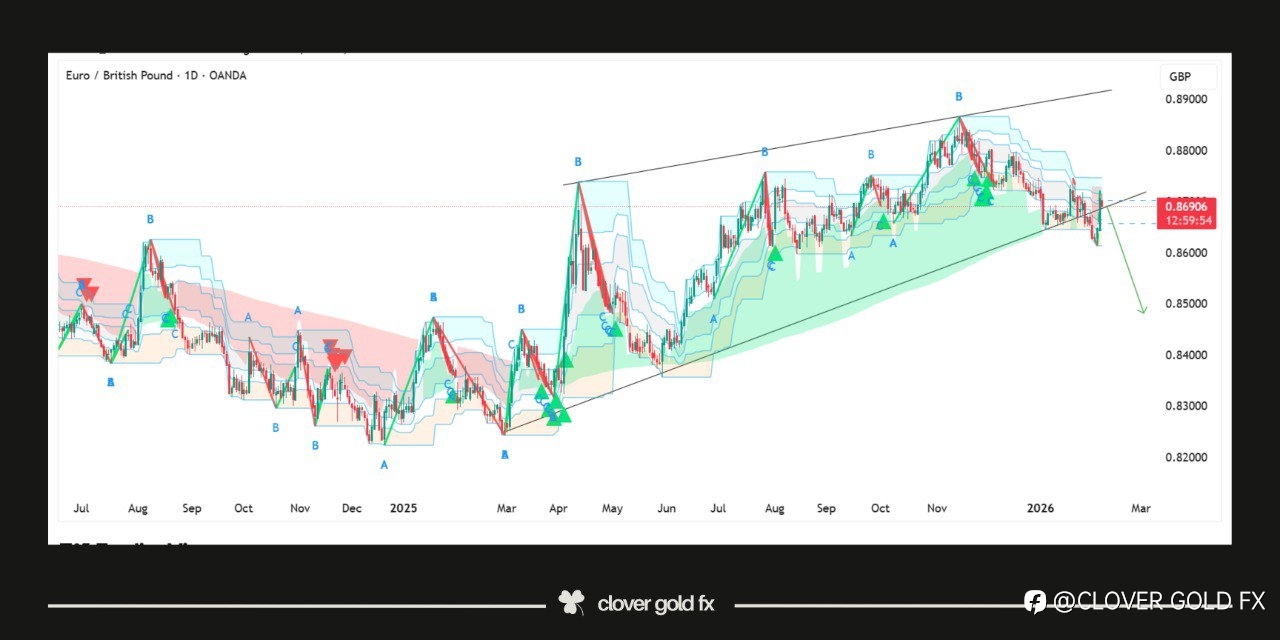
EURGBP on the daily is respecting a rising wedge structure where price has completed a full corrective sequence into the upper boundary and is now showing clear loss of momentum. The recent rejection ...
展开
CLOVER GOLD FX
02月02日
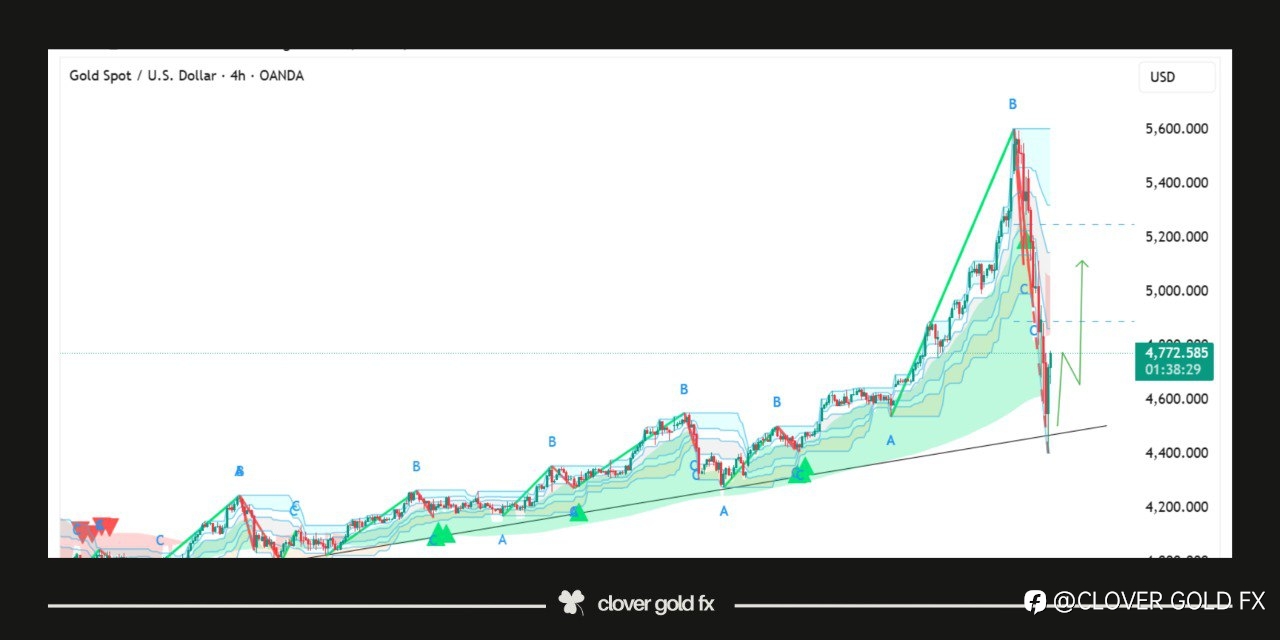
GOLD On the 4H chart XAUUSD has completed a clear impulsive structure with a strong wave five expansion followed by a sharp corrective selloff that respected the higher timeframe daily trend line supp...
展开
CLOVER GOLD FX
01月20日
Don’t let market drops scare you; they are often just the preparation for the next major leap. Wave (i) is complete, and price is now gathering strength within the Wave (ii) correction for the next p...
展开
CLOVER GOLD FX
01月20日
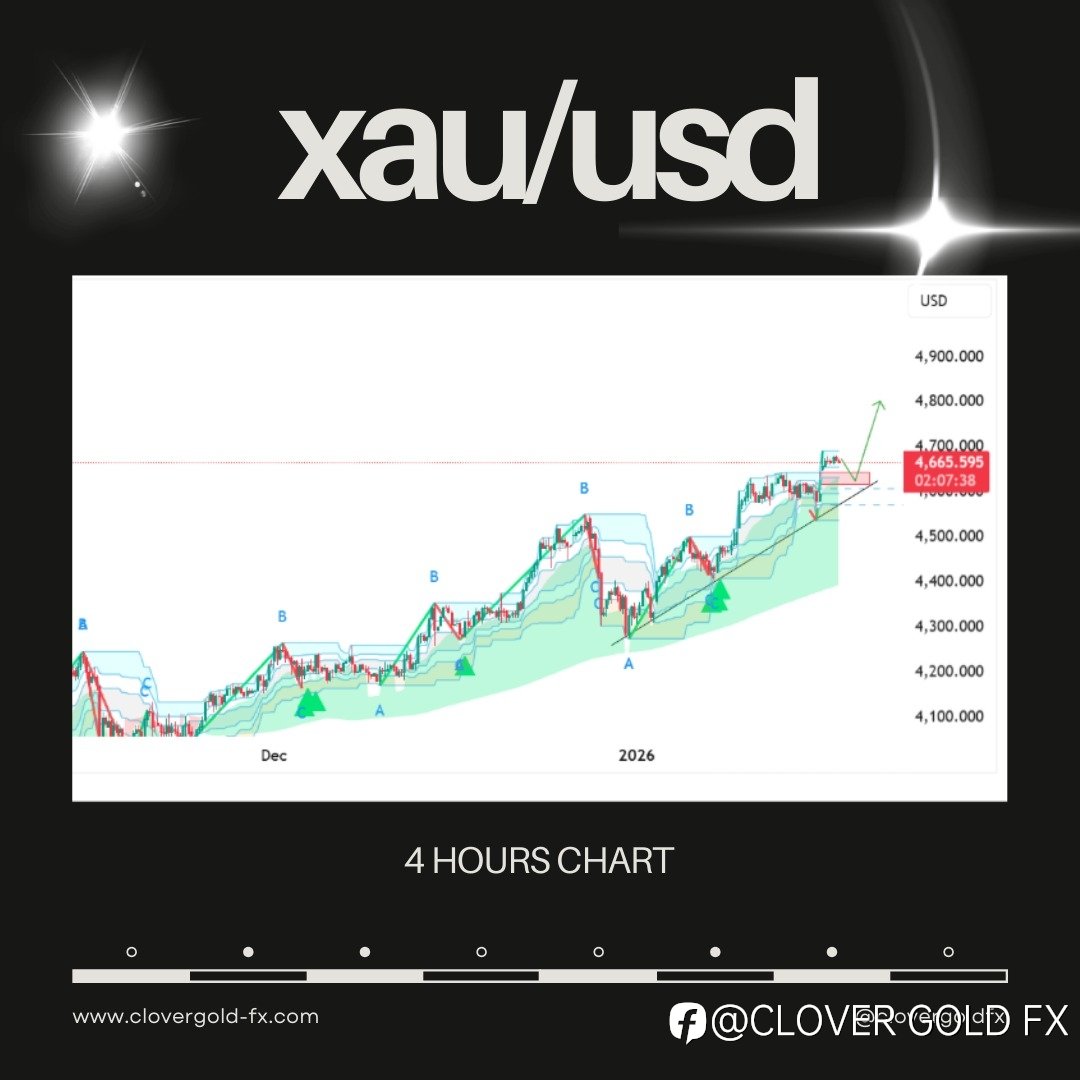
XAUUSD shows a clear bullish structure supported by repeated demand reactions and a well respected ascending trend support that confirms strong buyer control. The market created higher lows and higher...
展开
CLOVER GOLD FX
01月20日
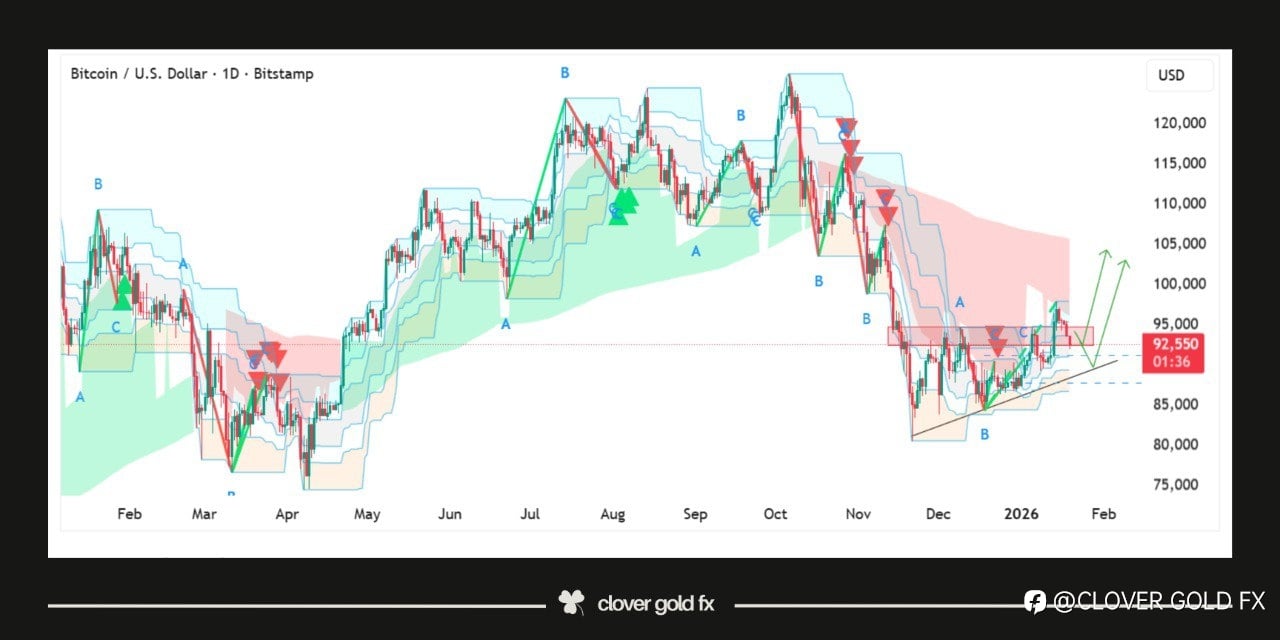
BTCUSD shows a completed corrective structure followed by a strong impulsive decline that appears to have finished its fifth wave near a rising support trendline after which price entered a consolidat...
展开
CLOVER GOLD FX
01月20日
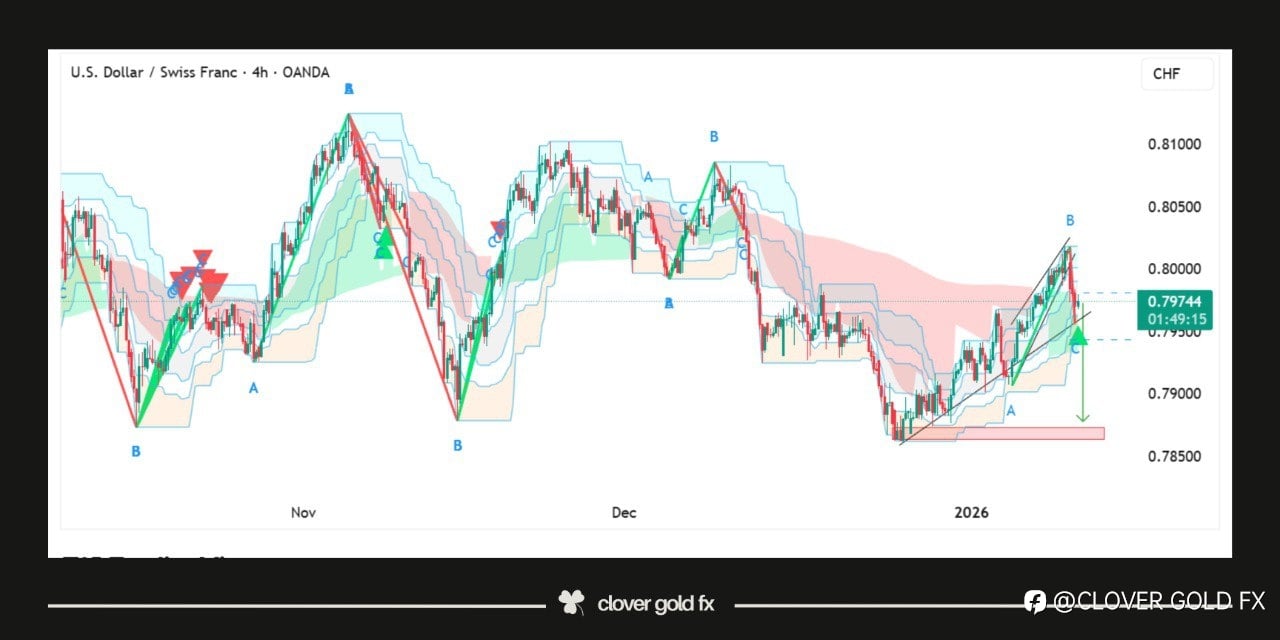
#usdchf #usdcad #dollar
CLOVER GOLD FX
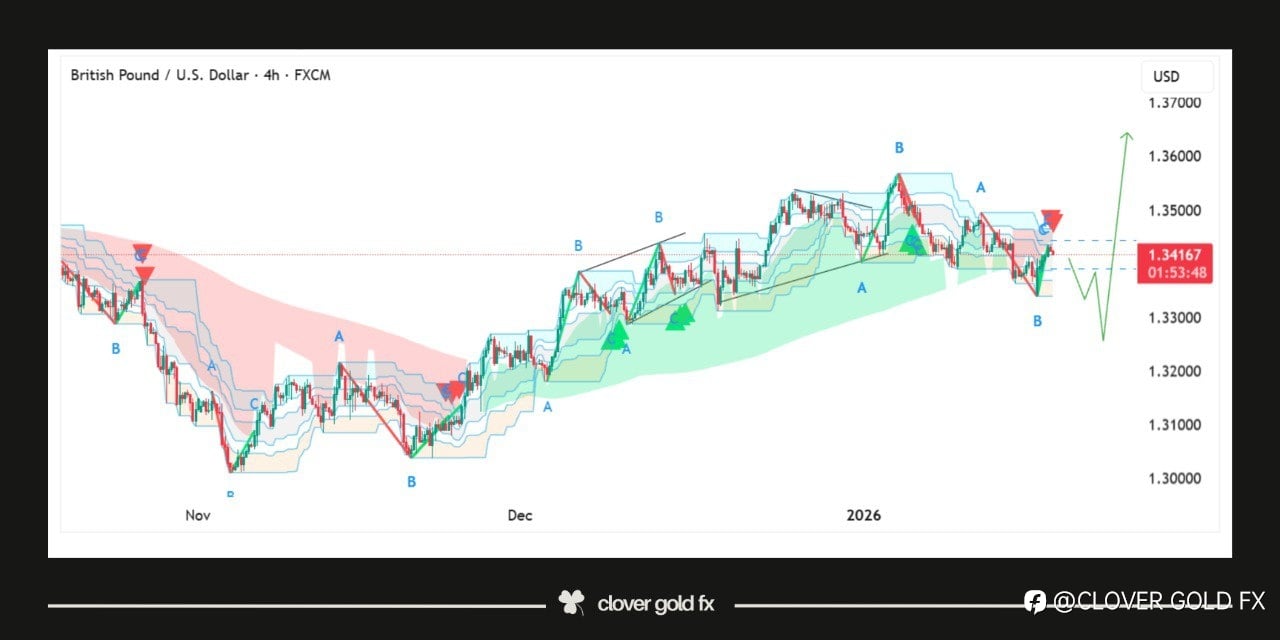
01月20日
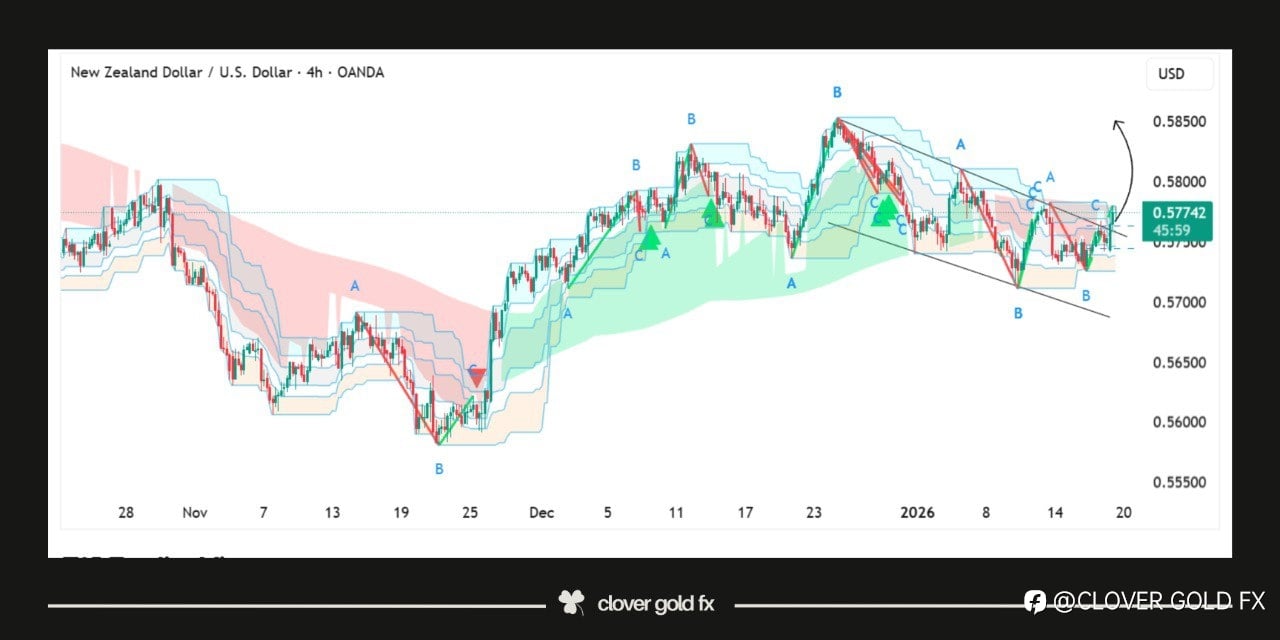
NZDUSD on the 4H chart shows a strong impulsive move followed by a controlled bullish flag correction. The a b c structure inside the flag reflects healthy consolidation rather than weakness and sugge...
展开
CLOVER GOLD FX
01月13日
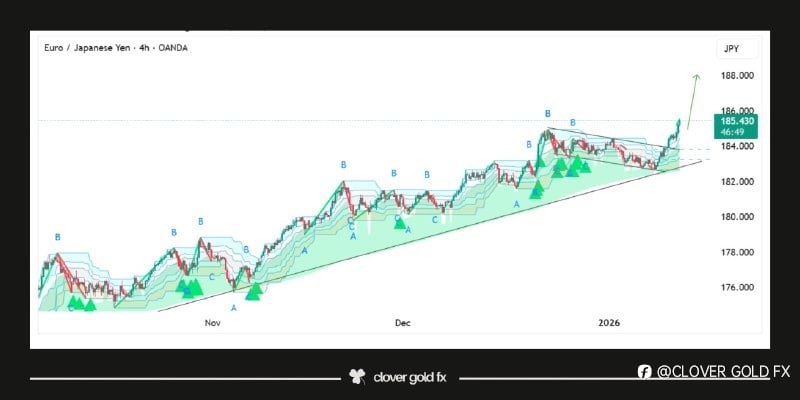
#EURJPY 🇪🇺🇯🇵 Corrections in a strong trend are gifts. #EURJPY gave us a shallow pullback into support, recharged its momentum, and is now ready for the next impulse. The JPY weakness con...
展开
CLOVER GOLD FX
01月12日
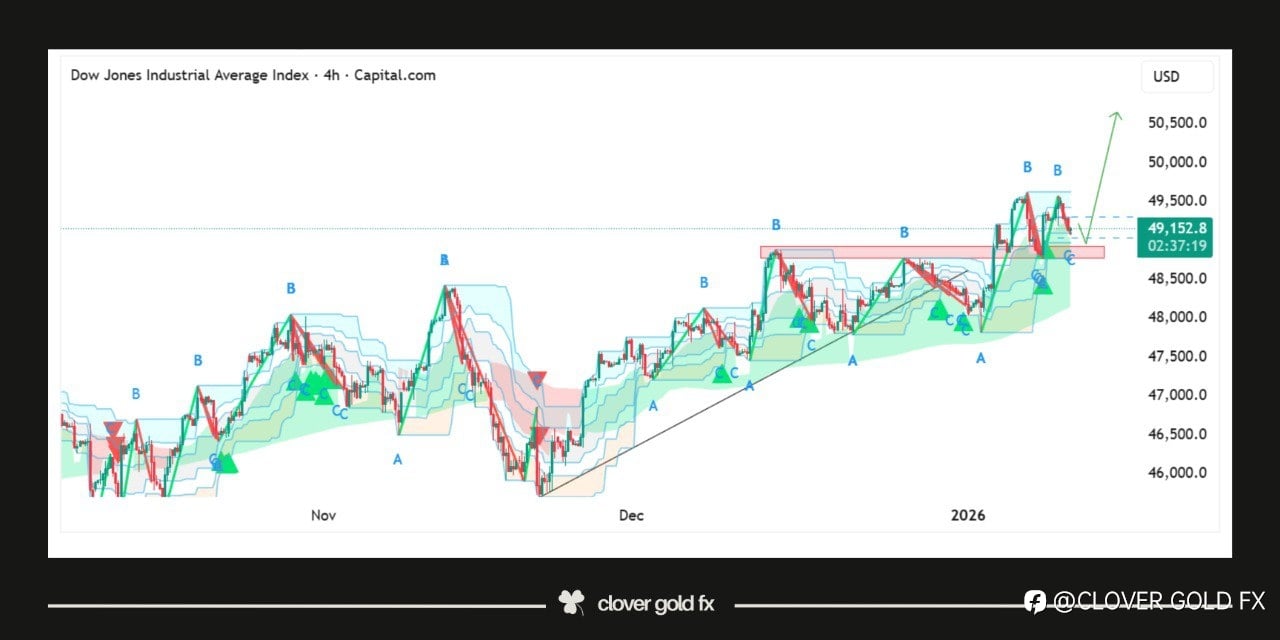
#us30 #us100 #us500
CLOVER GOLD FX
01月12日
Price is moving within a symmetrical Triangle and end of triangle near wave E.
CLOVER GOLD FX
01月12日
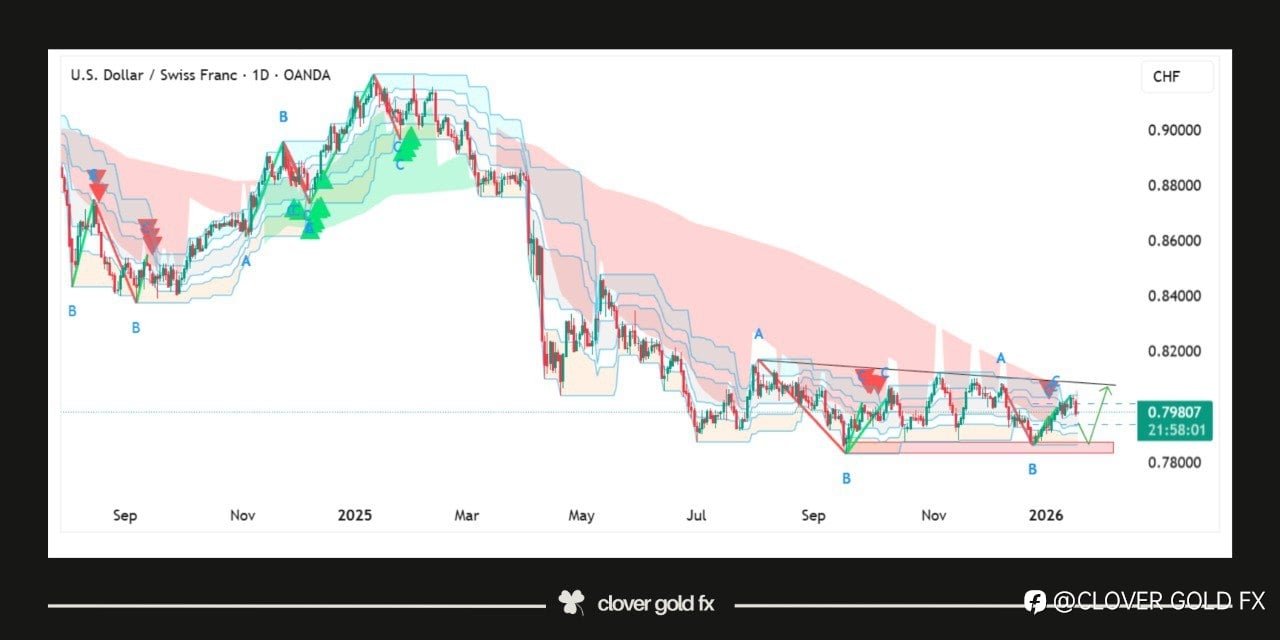
USDCHF is showing a completed corrective structure followed by a rising wedge which often signals trend exhaustion and potential reversal The market formed a clear five wave decline that respected a s...
展开
CLOVER GOLD FX
2025年12月23日
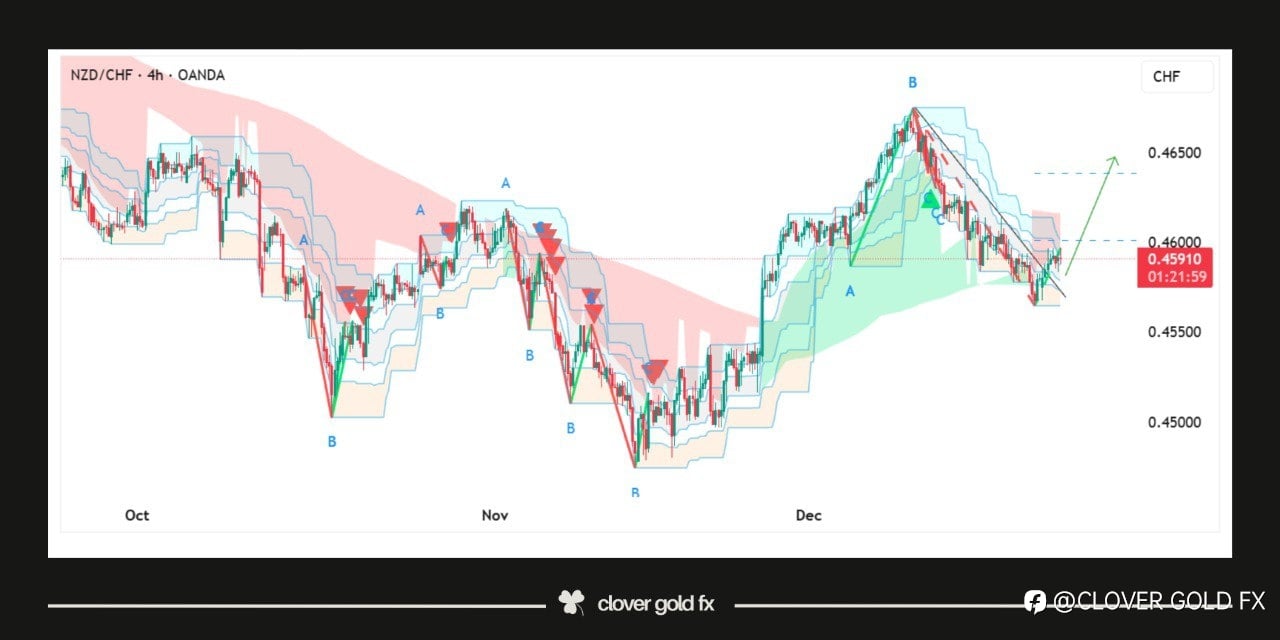
NZDCHF is showing a corrective structure after completing a strong impulsive advance where the market topped and entered a pullback phase that unfolded in a clear three wave correction this correctio...
展开
CLOVER GOLD FX
2025年12月22日
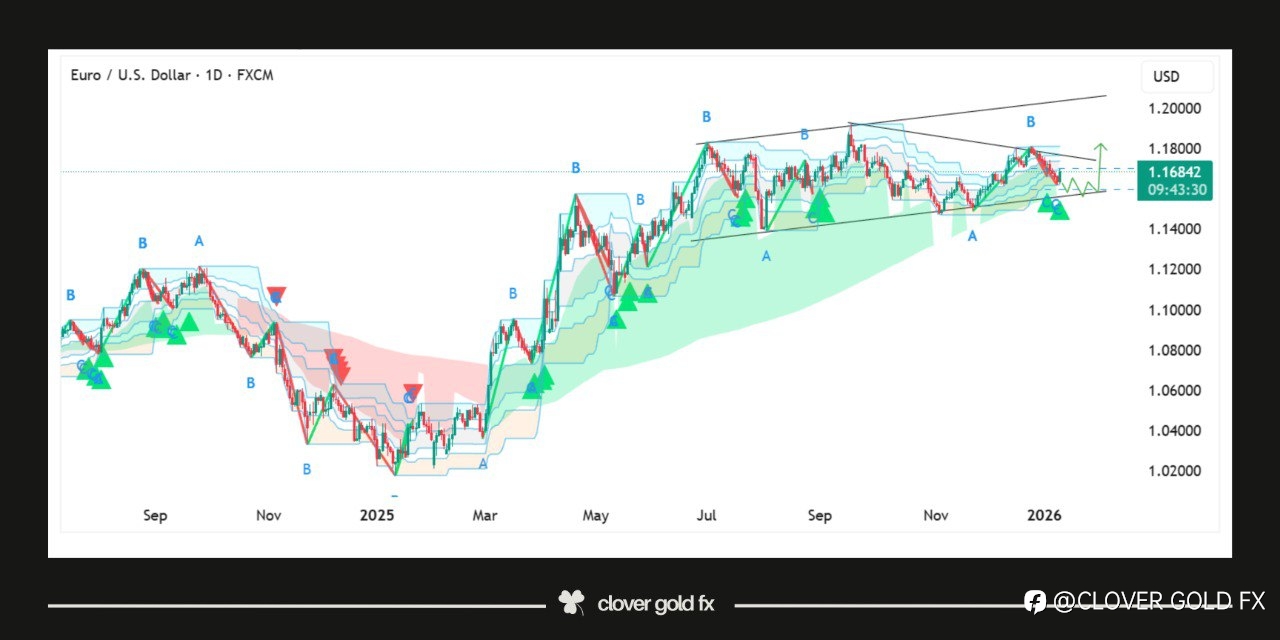
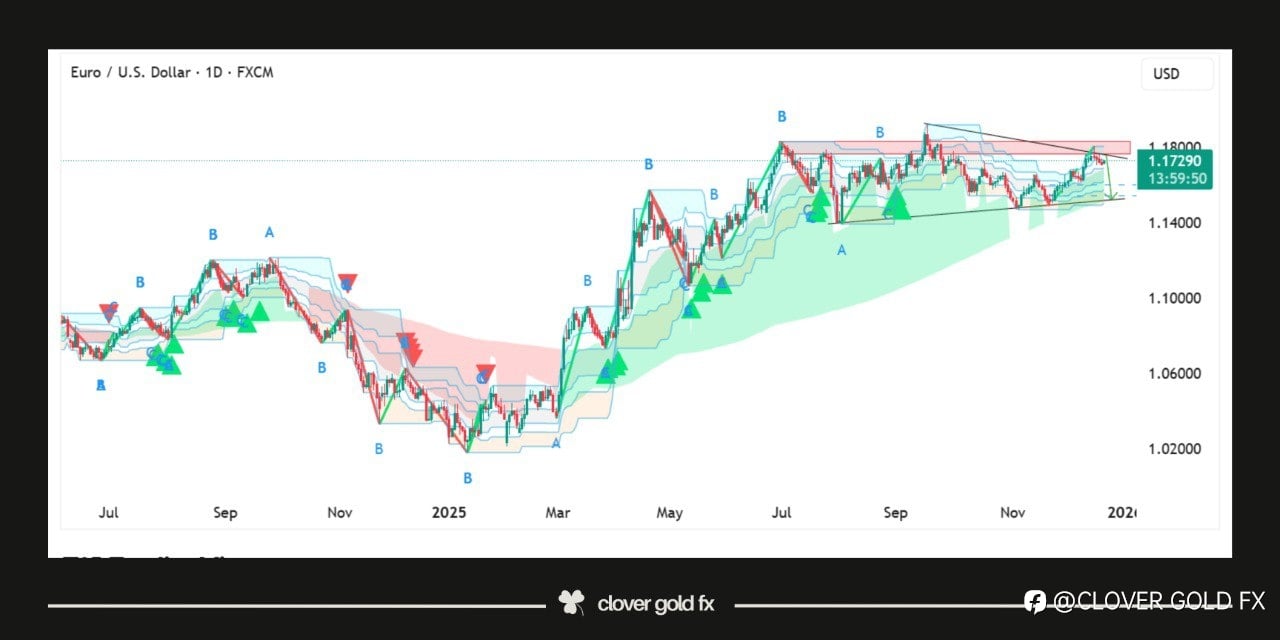
#eurusd EURUSD shows a mature bullish structure that has transitioned into a contracting corrective phase. The prior impulse completed cleanly and price is now respecting a rising support trendline w...
展开
正在加载中...