Setup Failed.
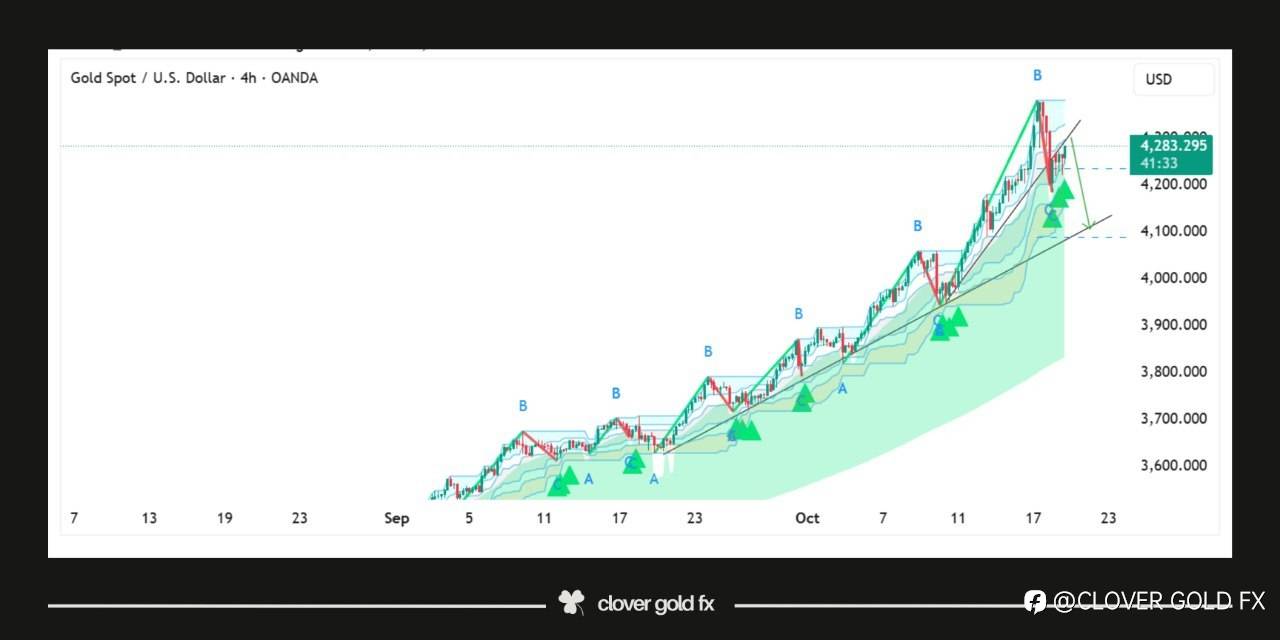
From a technical perspective, gold’s surge on October 20, 2025, was supported by a strong bullish breakout above the previous resistance zone near $4,150 per ounce, confirming a continuation of the uptrend that had been forming since early Q3 2025. The move was accompanied by high trading volume and a bullish crossover on major momentum indicators such as the MACD and RSI, signaling strong buying pressure. The price also remained well above key moving averages particularly the 50-day and 200-day EMAs which acted as dynamic support levels. In addition, a weakening U.S. dollar index (DXY) and falling bond yields further reinforced the bullish technical setup. Together, these factors created a confluence of technical signals that drove gold to a new all-time high around $4,300 per ounce during that week.
已编辑 21 Oct 2025, 01:35
风险提示:本文所述仅代表作者个人观点,不代表 Followme 的官方立场。Followme 不对内容的准确性、完整性或可靠性作出任何保证,对于基于该内容所采取的任何行为,不承担任何责任,除非另有书面明确说明。


加载失败()