#cadchf #cad #chf
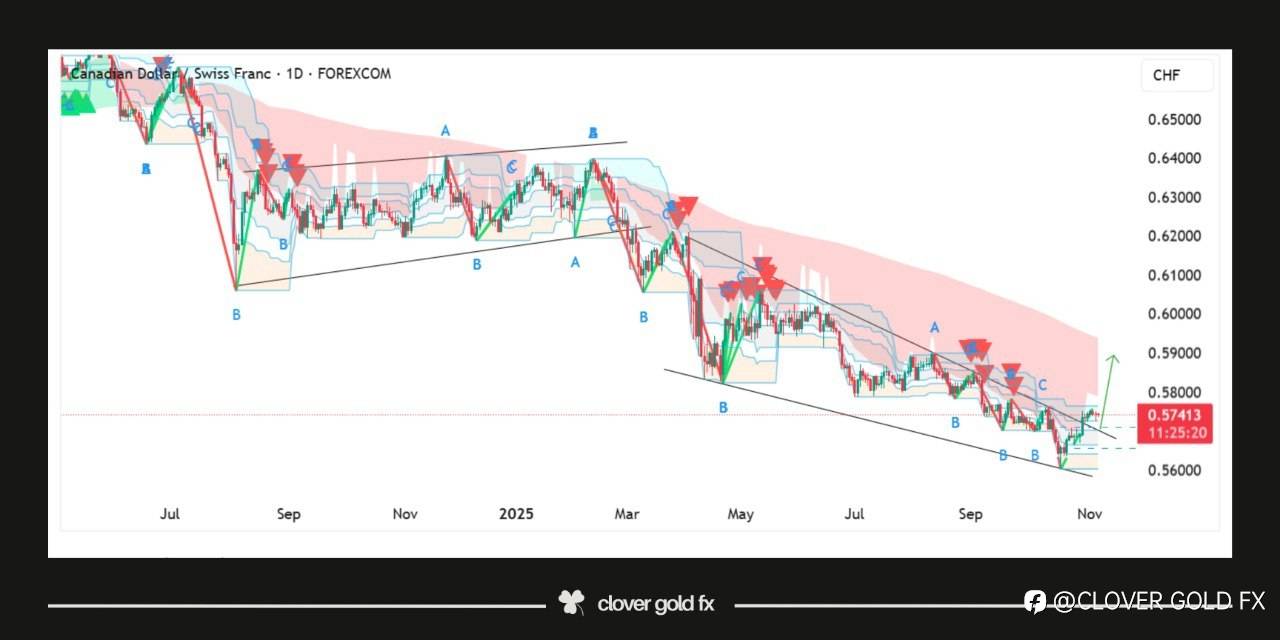
The CADCHF 14H chart shows that the pair has been trading in a clear downtrend forming a falling wedge pattern after an extended bearish move. The recent solid breakout from the wedge signals a potential shift in momentum as buyers start gaining strength. The breakout candle indicates increased bullish activity suggesting that the market may attempt a corrective rally toward the next resistance area shown by the red arrow. This upward move represents a possible reversal phase where price could retest previous structure levels before deciding its next major direction. Overall the chart reflects early signs of recovery with the breakout acting as a key confirmation for short term bullish continuation.
风险提示:本文所述仅代表作者个人观点,不代表 Followme 的官方立场。Followme 不对内容的准确性、完整性或可靠性作出任何保证,对于基于该内容所采取的任何行为,不承担任何责任,除非另有书面明确说明。

暂无评论,立马抢沙发