
#candlestick#
1.66k 浏览
196 讨论
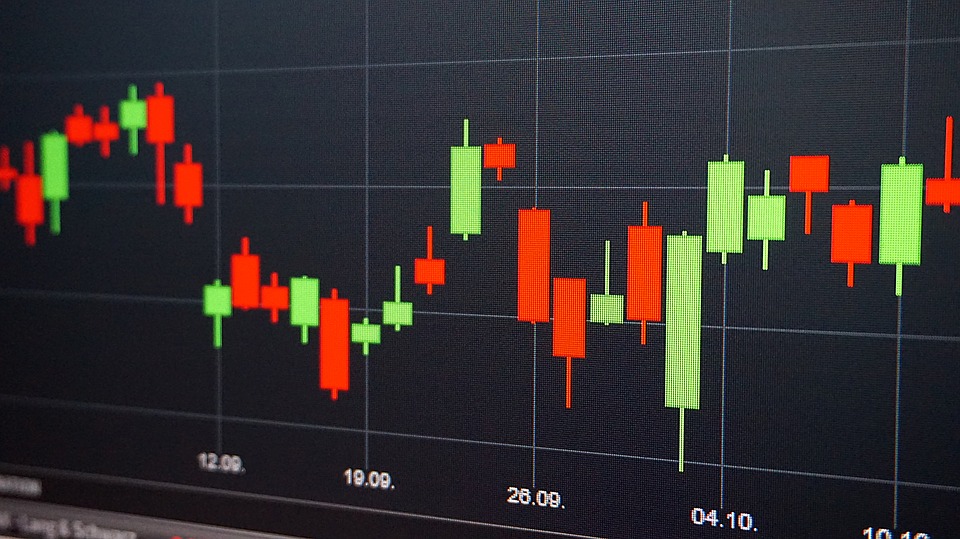
A candlestick chart (also called Japanese candlestick chart) is a style of financial chart used to describe price movements of a security, derivative, or currency. Each "candlestick" typically shows one day, thus a one-month chart may show the 20 trading days as 20 candlesticks. Candlestick charts can also be built using intervals shorter or longer than one day.
分享你的交易经验吧!
Momen Tepat Entry dengan Candlestick Pattern
Candlestick pattern seperti Doji, Hammer, dan Engulfing sering jadi sinyal pembalikan arah harga. Contohnya, Hammer di support bisa menandakan pembalikan dari downtrend ke uptrend. Tapi jangan asal pakai, selalu lihat konfirmasi dari volume dan tren utama.

- Followme :Weibo has obtained the basic prize in the Opinion Leader Program: 20 FOCIN that can withdraw. Click to know more details about //socia...
正在加载中...