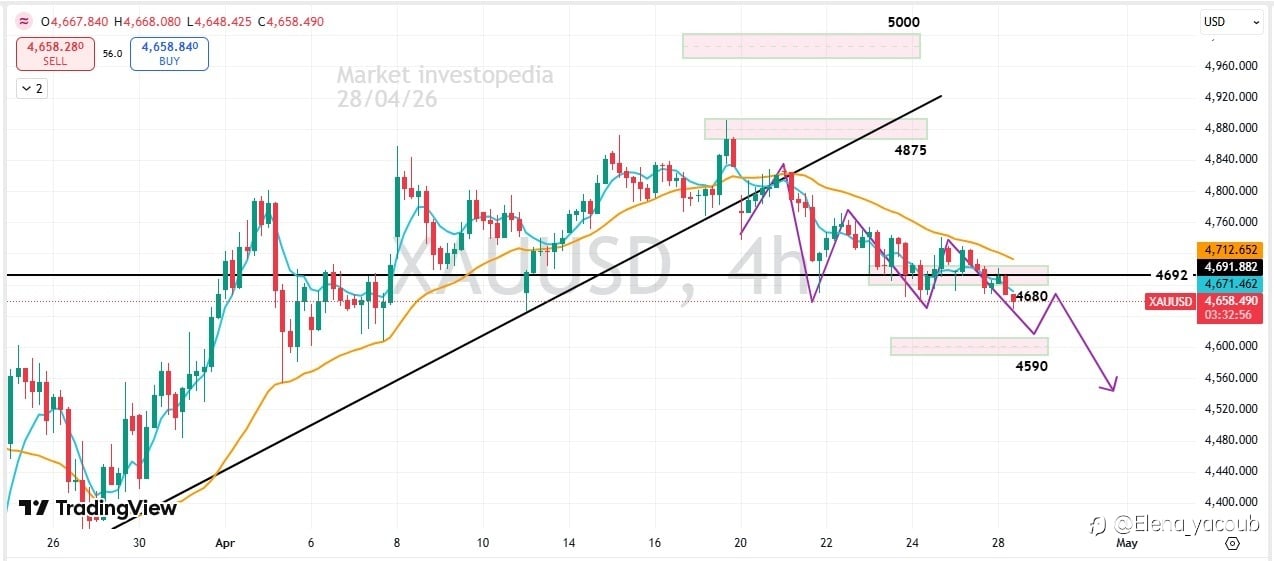
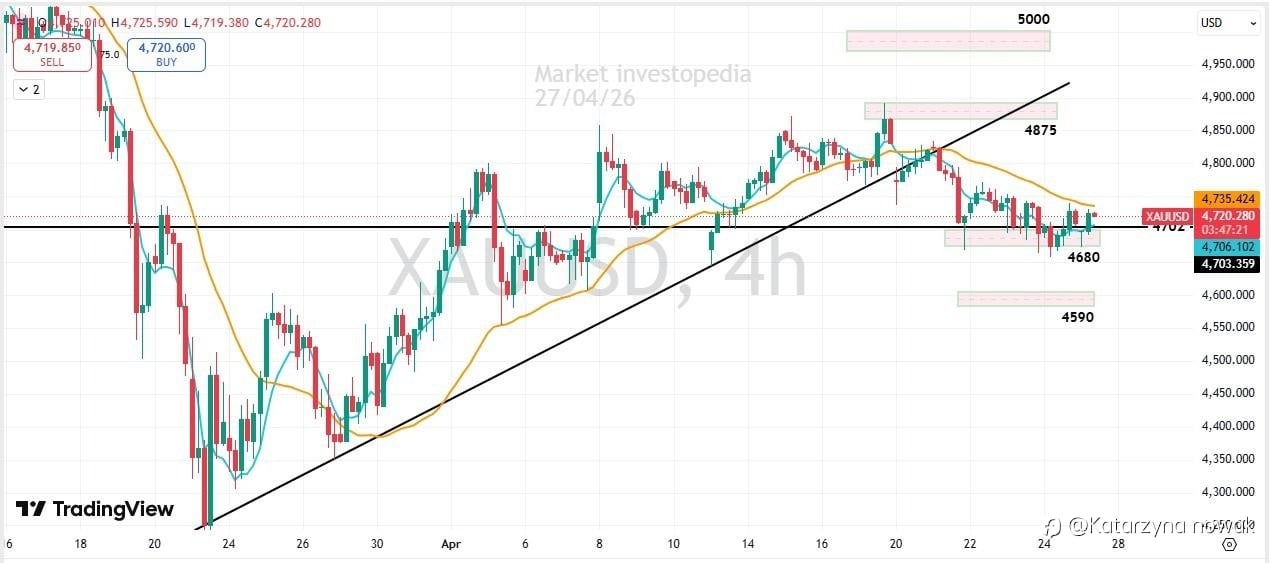
Technical And Fundamental Analysis
Technical Analysis Gold is currently dominated by a strong short-term bullish trend, supported by price action remaining consistently above the 50-day Exponential Moving Average (EMA50). Resistance Levels: Immediate resistance is noted at $4,821; a sustained break above this lev
📈 GOLD BUY ALERT | Strong Demand Zone + 1:2 RR & Bigger Targets Ahead
📊 Trade Details RecapDirection: BUYEntry: 4789.41Stop Loss: Below 4777.608TP1: 1:2 RRTP2: 4885.000TP3: 5100.000🔍 Market Structure Analysis (from the chart)1️⃣ Trend Context – Strong Bullish Market is clearly printing HH (Higher Highs) and HL (Higher Lows).Momentum leg after a strong impulsive move
Fundamental and Technical Trajectories for the Week of January 5-11, 2026
The global gold market enters the first full trading week of January 2026 positioned at a historical and psychological crossroads. Following an extraordinary fiscal year in 2025, characterized by a staggering appreciation of nearly 65% to 70%—the most significant annual gain since 1979—the yellow me
Technical Analysis GOLD – Watch for a Reversal Near Key Support
Chart Overview: The gold chart (likely XAU/USD) is shown on a short-term timeframe with several technical indicators plotted. The title “BLACK WHOLE” may refer to a critical support zone or a bearish structure currently being tested. Key Levels: · Resistance: 4400 (near MA/EMA confluence), 43
- Beyond_charts :message for more premium insights or join my community.
Technical Analysis Gold Intraday Outlook
Gold Intraday Outlook - Navigating Choppy ConditionsAnalysis Date: December 15, 2025Instrument: XAU/USD (Gold)Time Frame: 30 MinutesExecutive SummaryGold's intraday price action is currently characterized by choppy, range-bound behavior, with a defined pivot point creating a cle
- Beyond_charts :text for personalized setups and live trades
正在加载中...
