注册
登录
忘记密码
热门
发现信号
交易联赛
交易商奖项
社区之星
市场
创作者
隐私政策
服务条款
帮助中心
联系我们
品牌专页
免责声明
更多...
© 2026 Followme
𝗧𝗛𝗘 𝗚𝗢𝗟𝗗
165 粉丝
·
140 关注
于
2023年08月23日 加入
关注
帖子
投资组合
简介
𝗧𝗛𝗘 𝗚𝗢𝗟𝗗
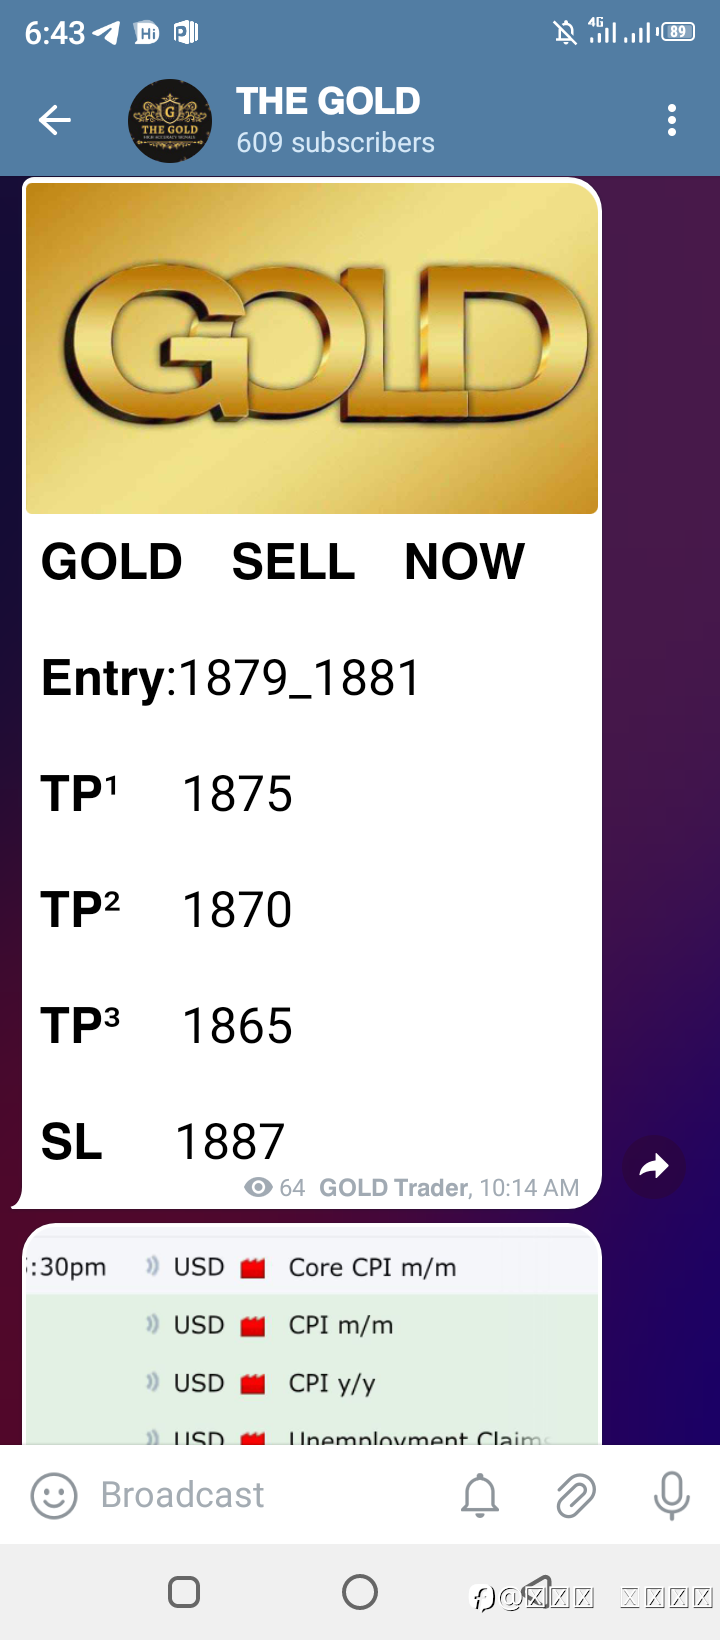
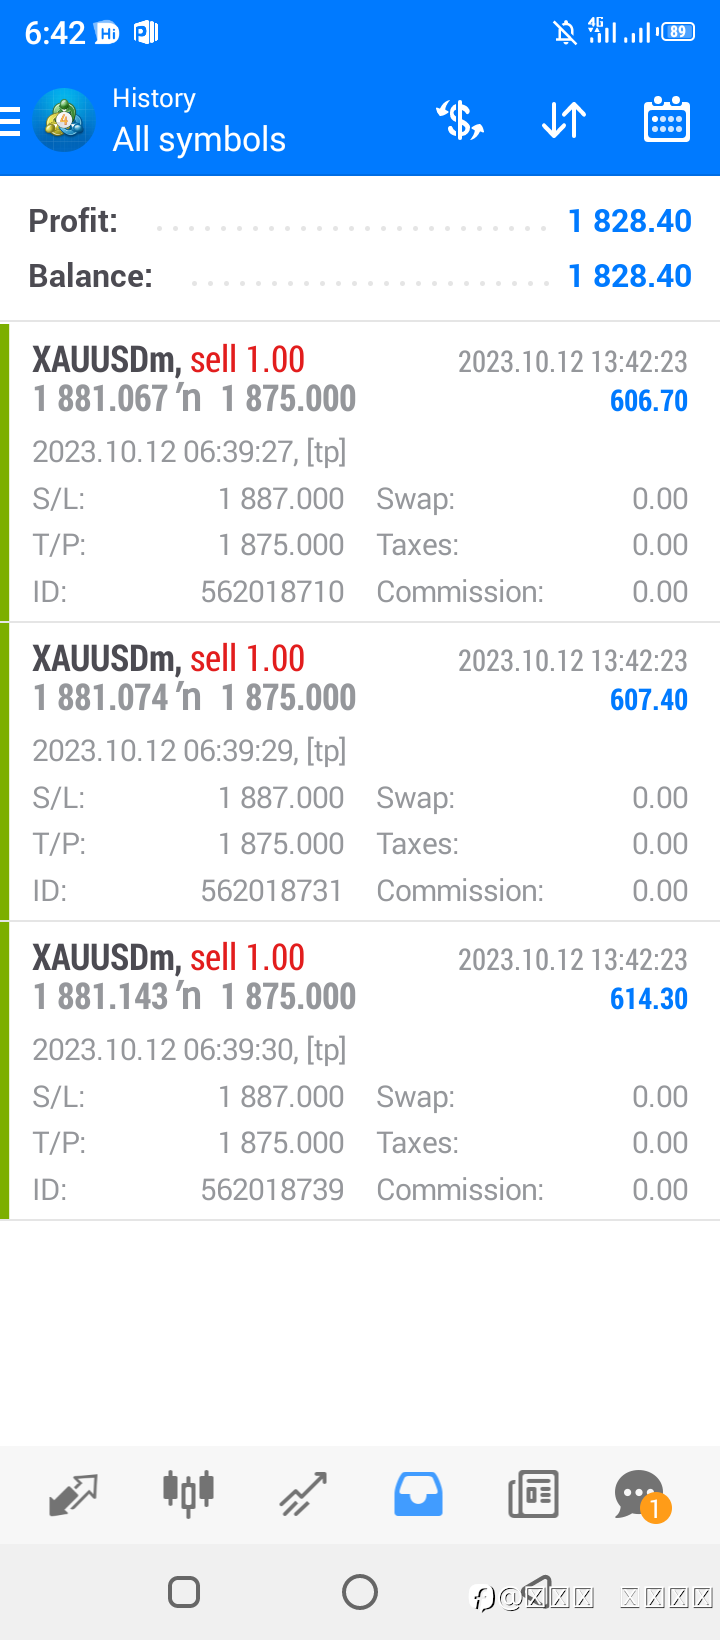
2023年10月12日
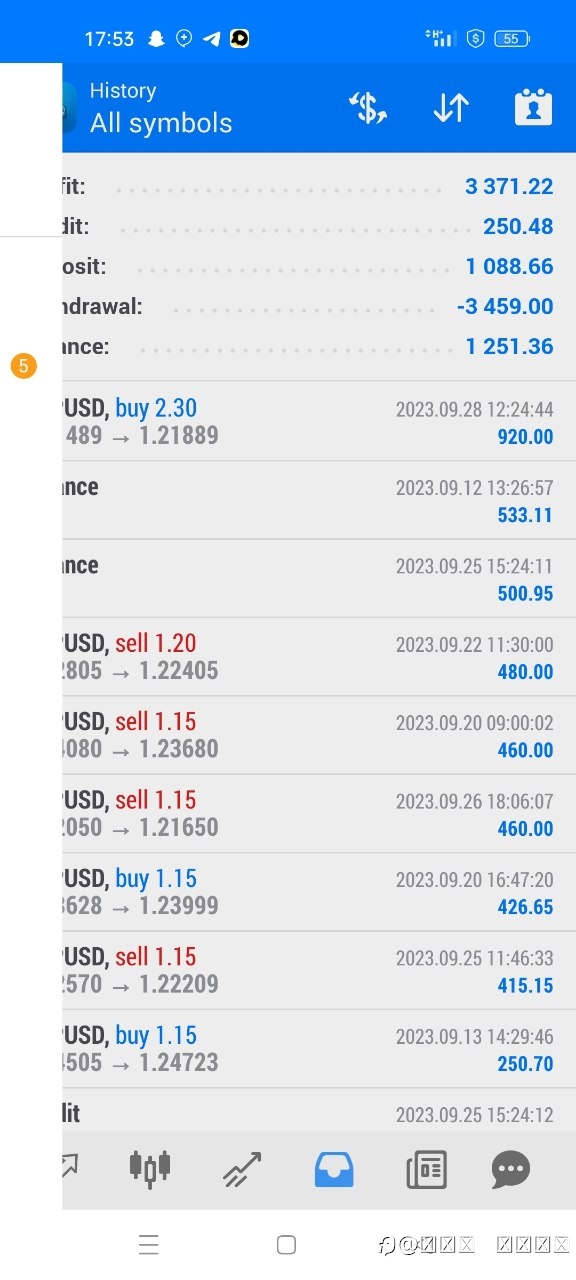
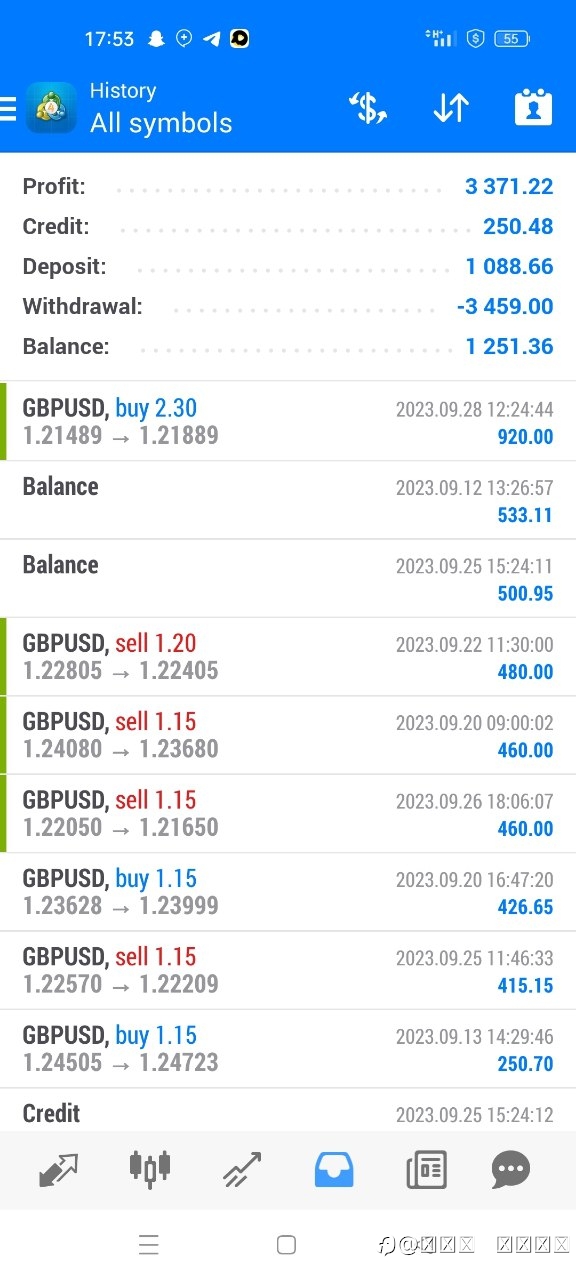
Account Management Result
𝗧𝗛𝗘 𝗚𝗢𝗟𝗗
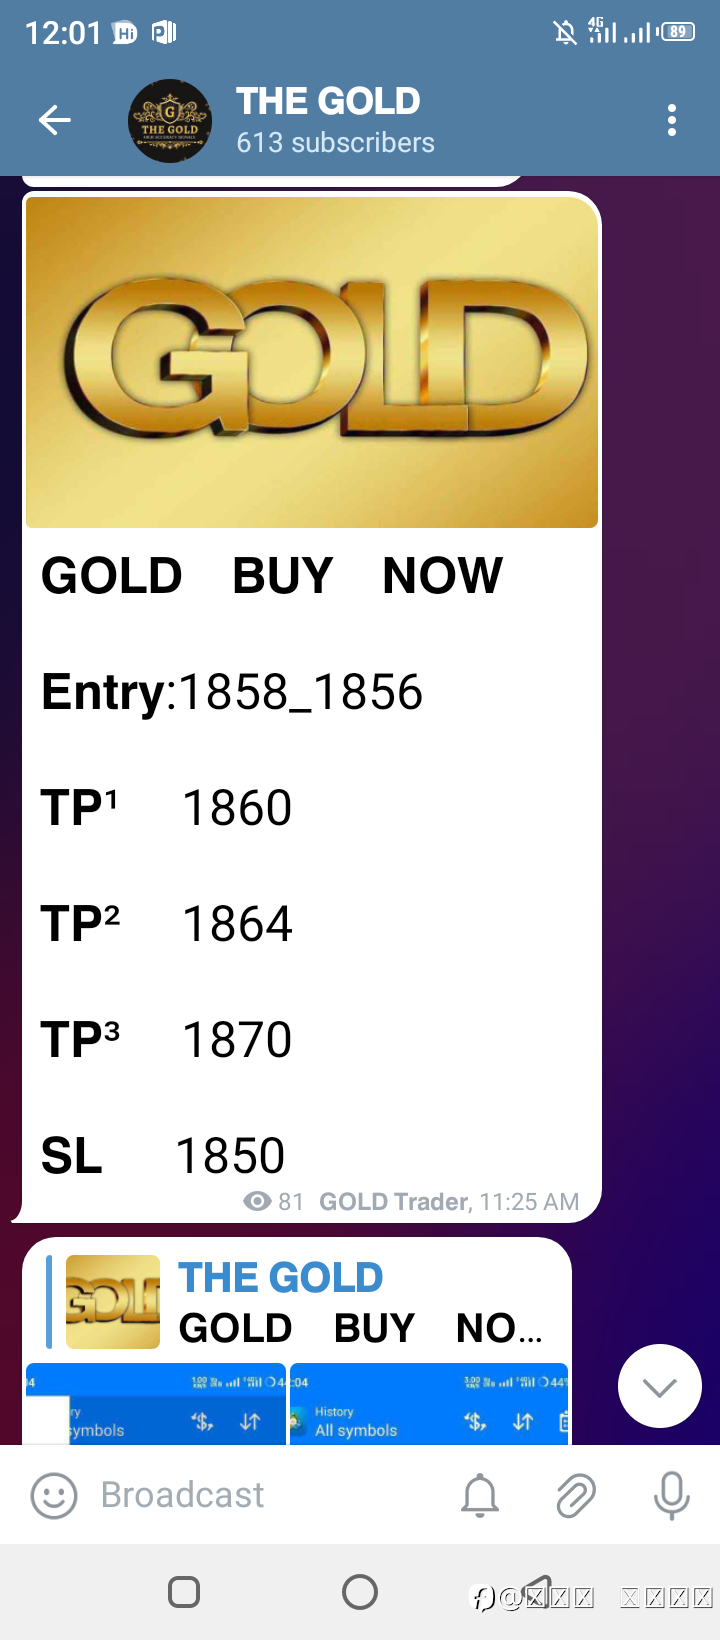
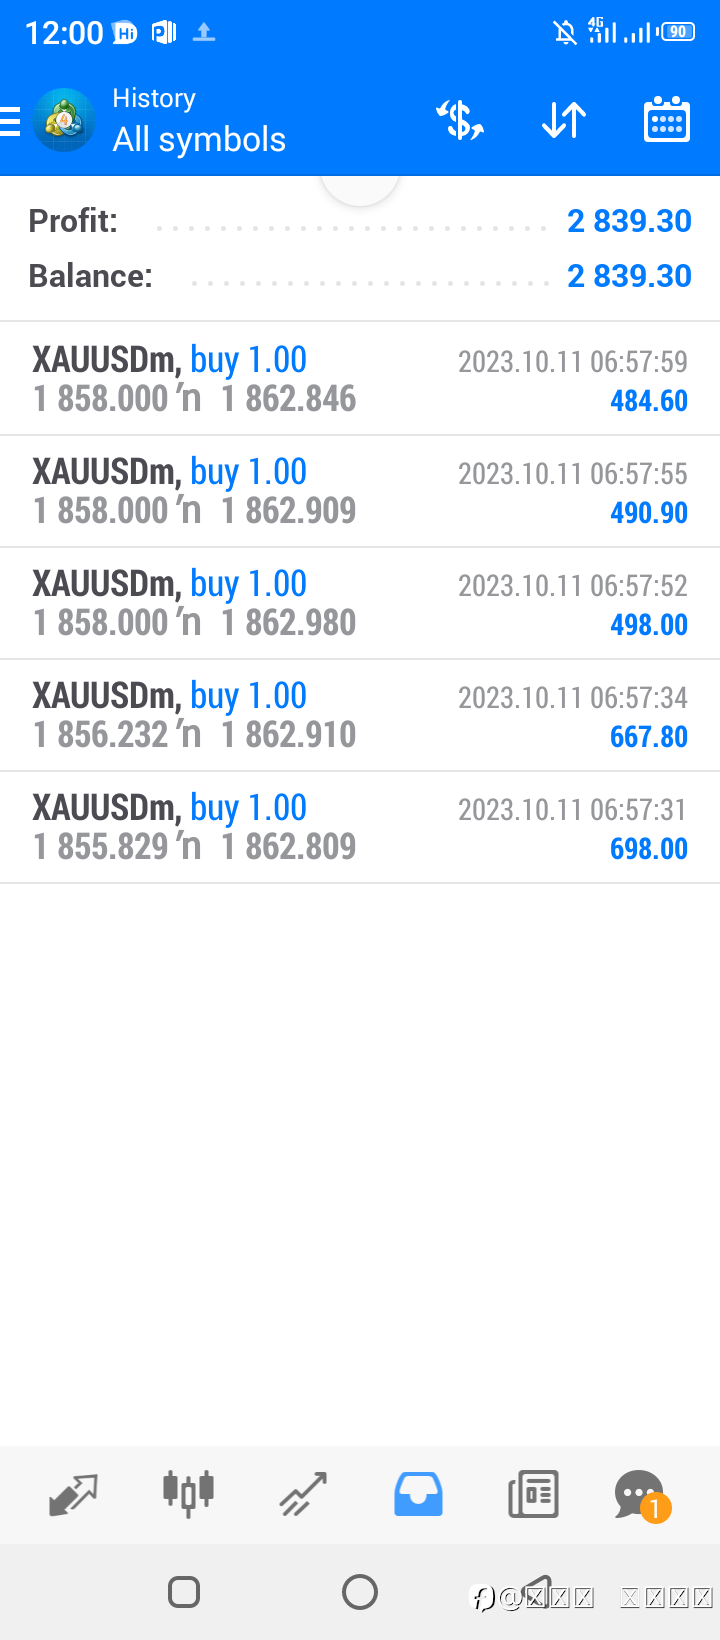
2023年10月11日
Account Management Service And VIP Paid Signals Available Contact Us
𝗧𝗛𝗘 𝗚𝗢𝗟𝗗
2023年10月09日
Account Management Service Available If You Have not experience About Trading Contact Me Guys
𝗧𝗛𝗘 𝗚𝗢𝗟𝗗
2023年10月09日
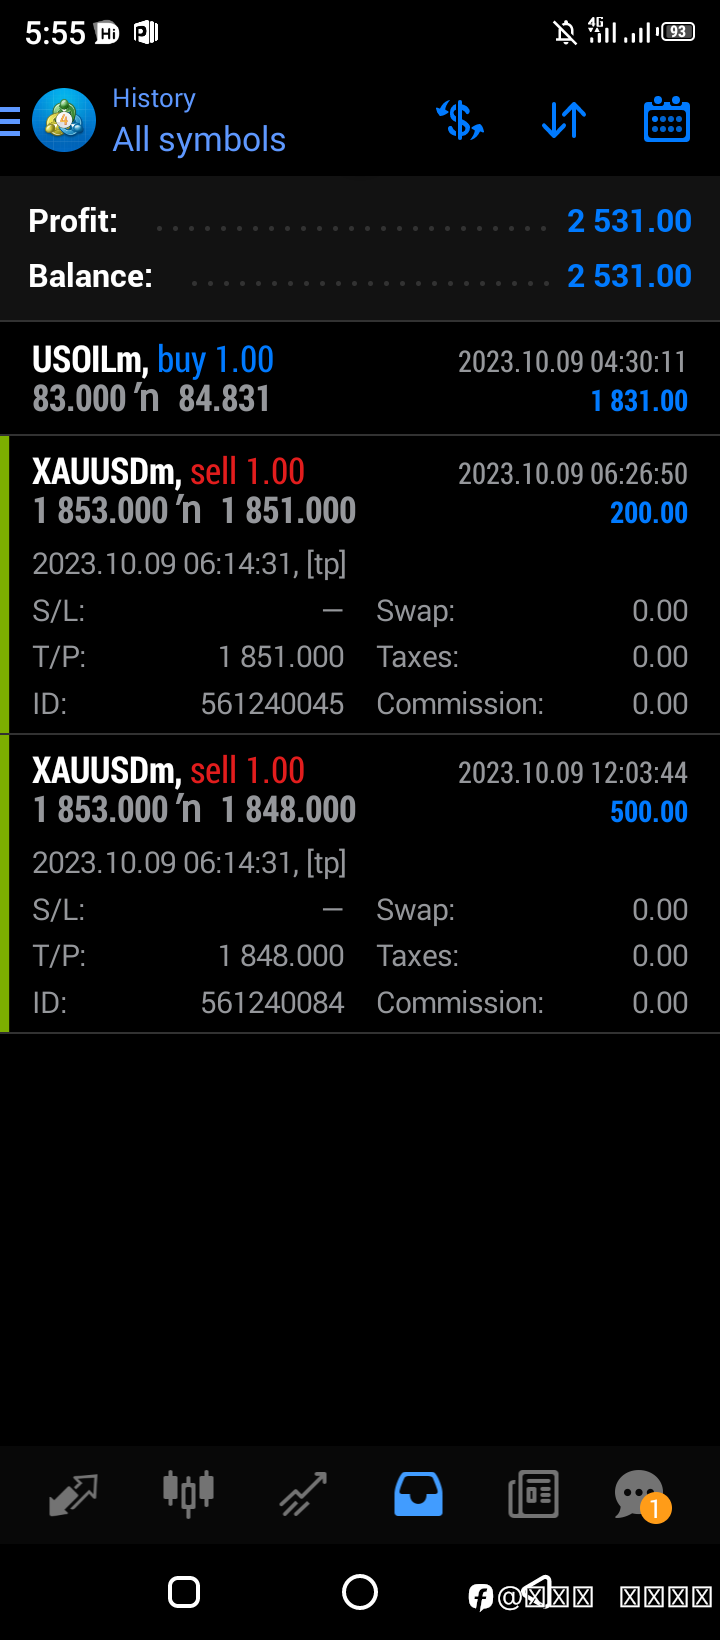
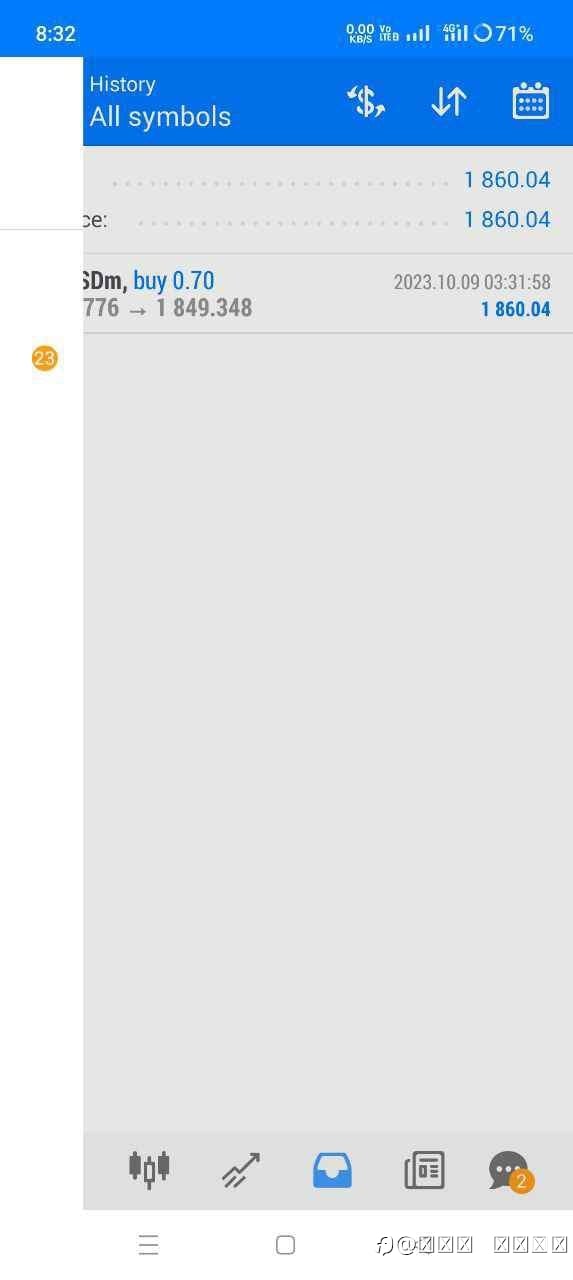
booked Profit
𝗧𝗛𝗘 𝗚𝗢𝗟𝗗
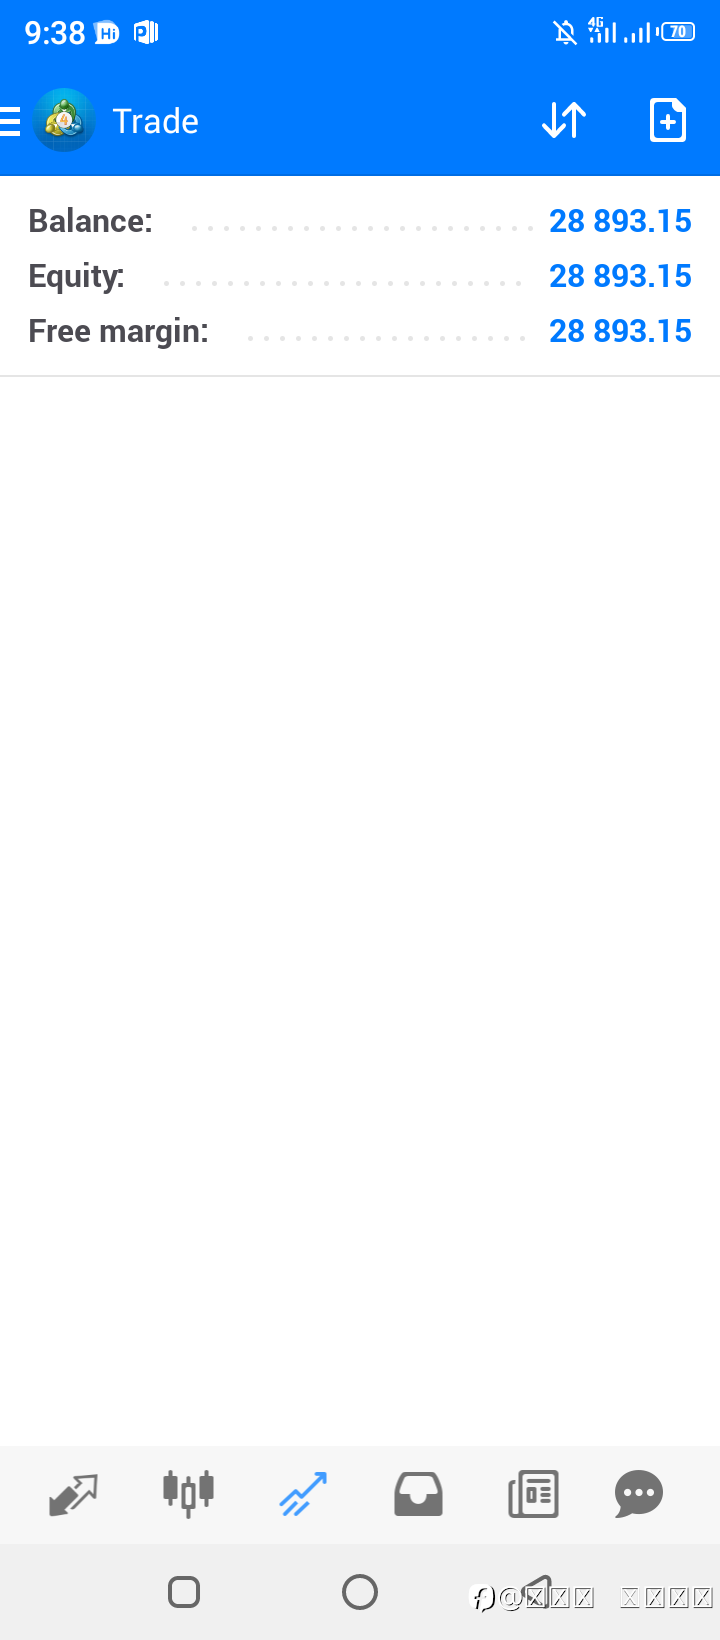
2023年10月07日
Account management is available 1000$ daily profit 300$ 2000$ daily profit 600$ 5000$ daily profit 1200$ 8000$ daily profit 1800$ 10000$ ...
展开
𝗧𝗛𝗘 𝗚𝗢𝗟𝗗
2023年10月06日
🔰 Non Farm Payrolls Day. 2 HOURS 05 MINUTES #Gold #USD
𝗧𝗛𝗘 𝗚𝗢𝗟𝗗
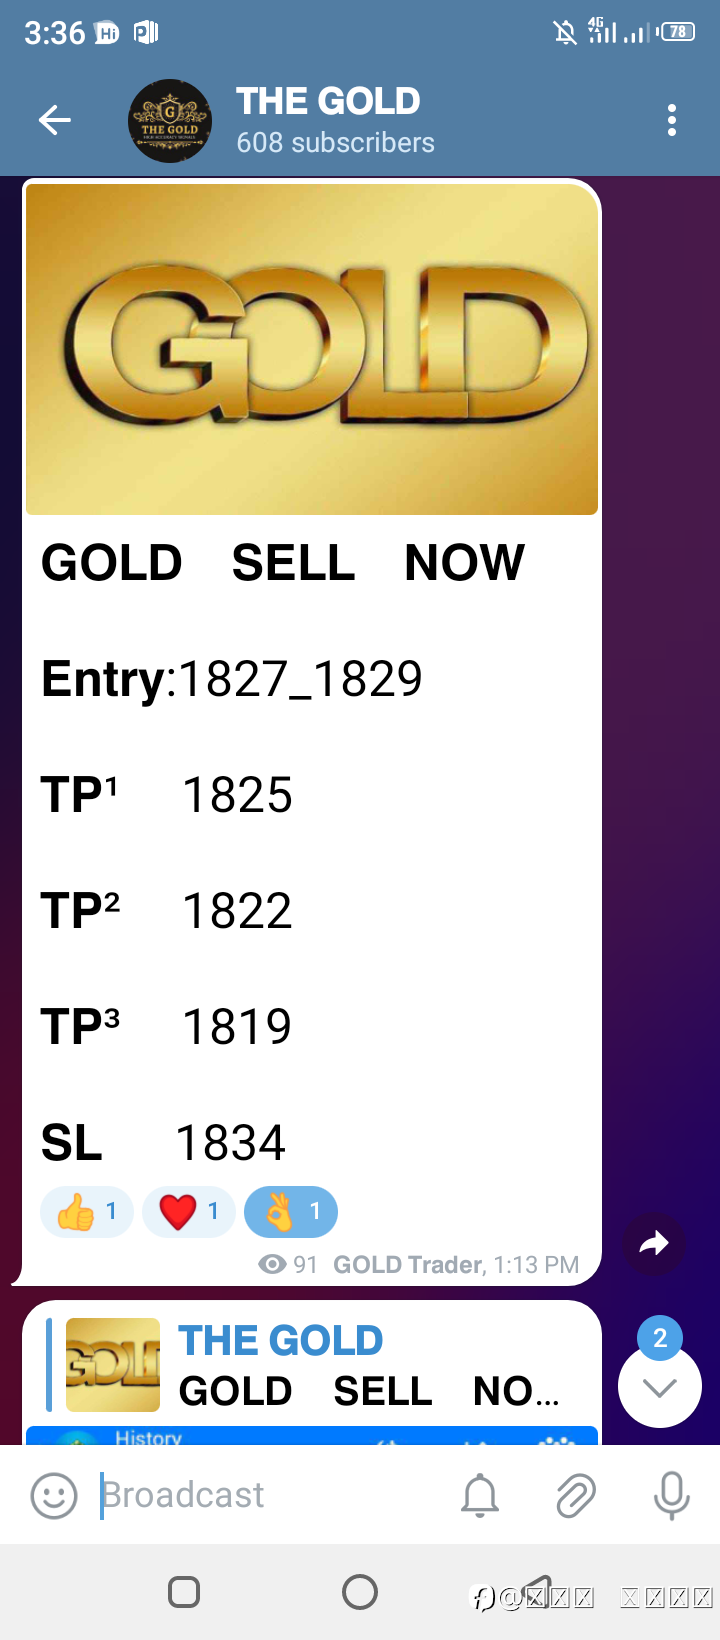
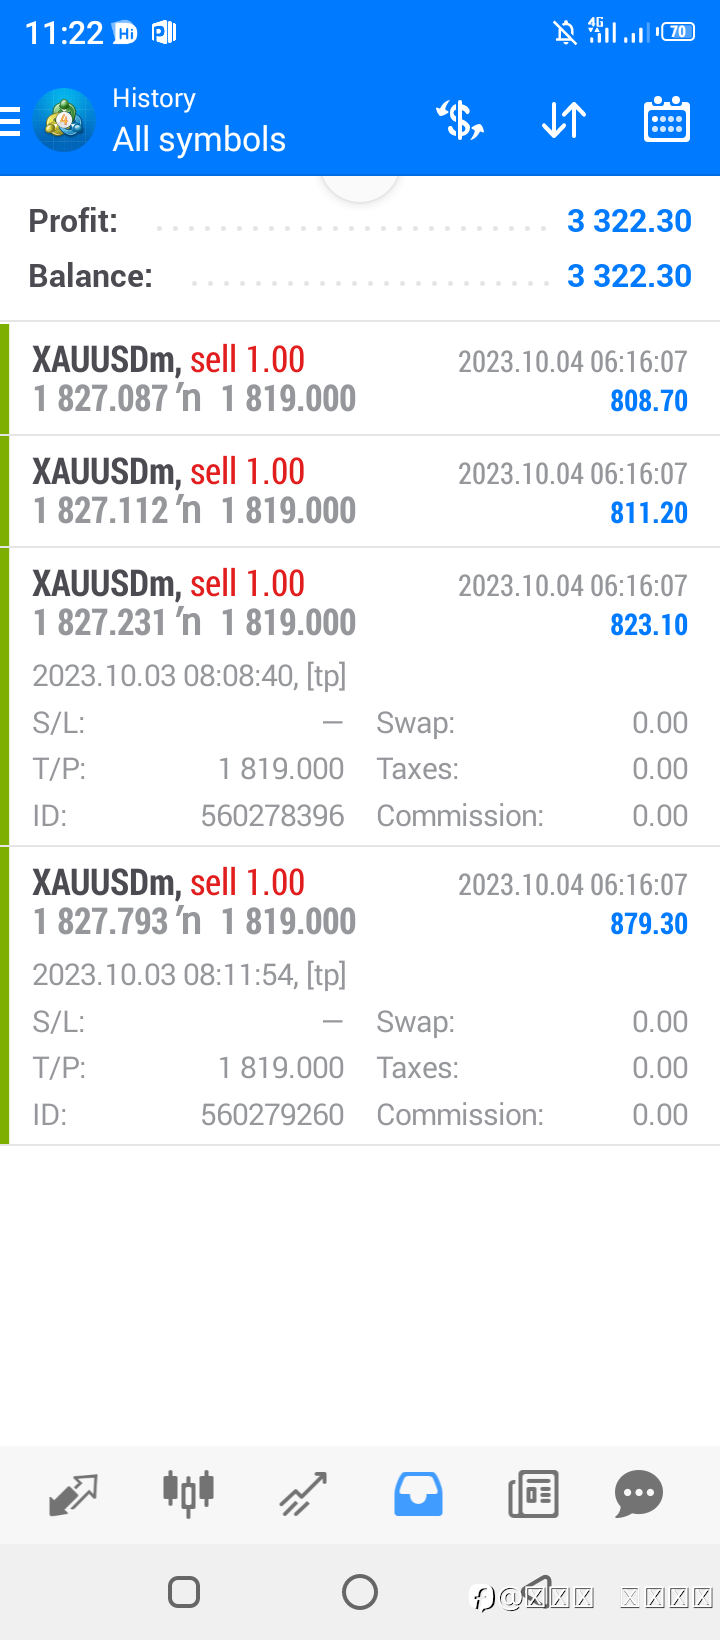
2023年10月04日
The GOLD Signal
𝗧𝗛𝗘 𝗚𝗢𝗟𝗗
2023年10月04日
Account Management Service Available Minimum Start From 5000$ To Unlimited Contact Admin
𝗧𝗛𝗘 𝗚𝗢𝗟𝗗
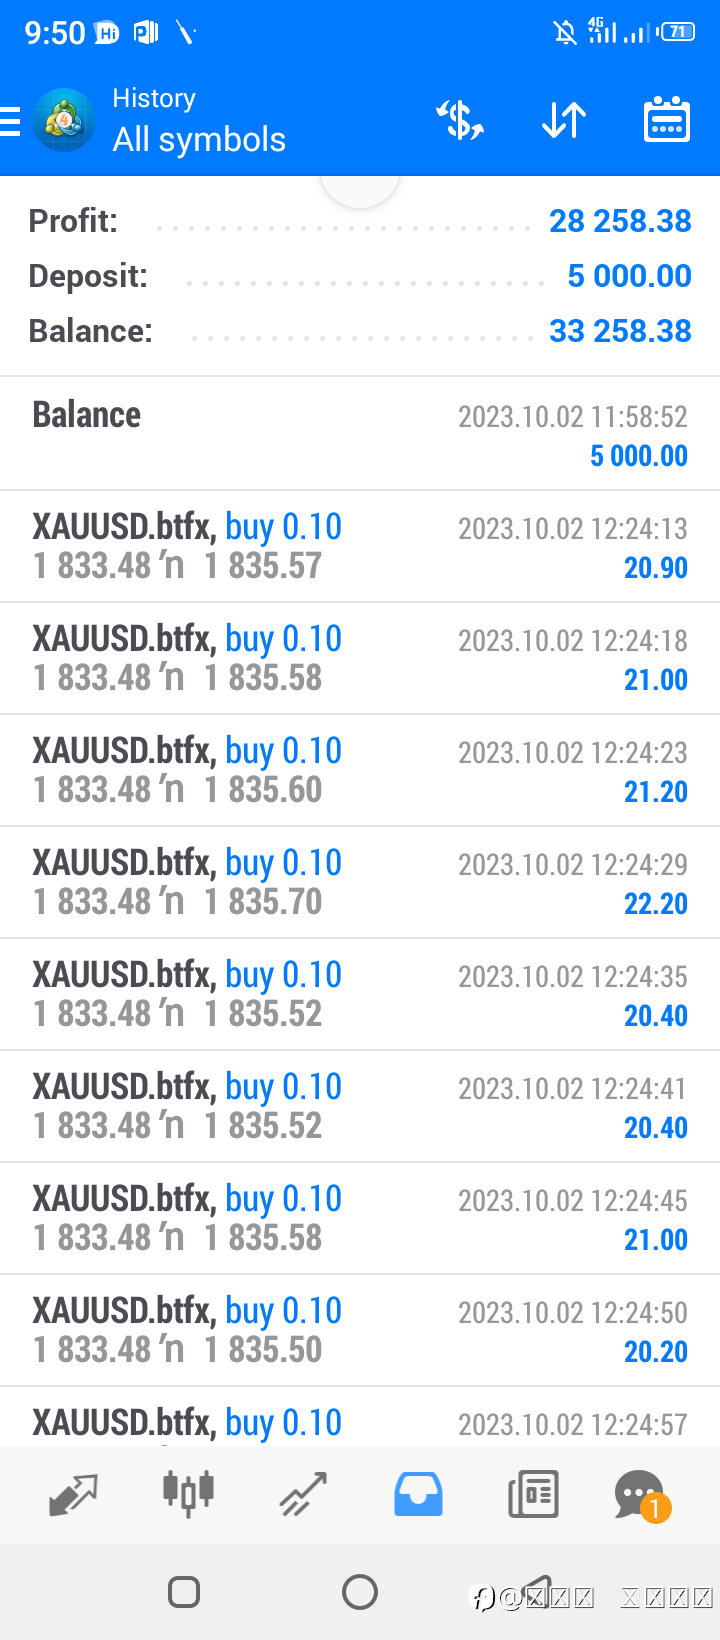
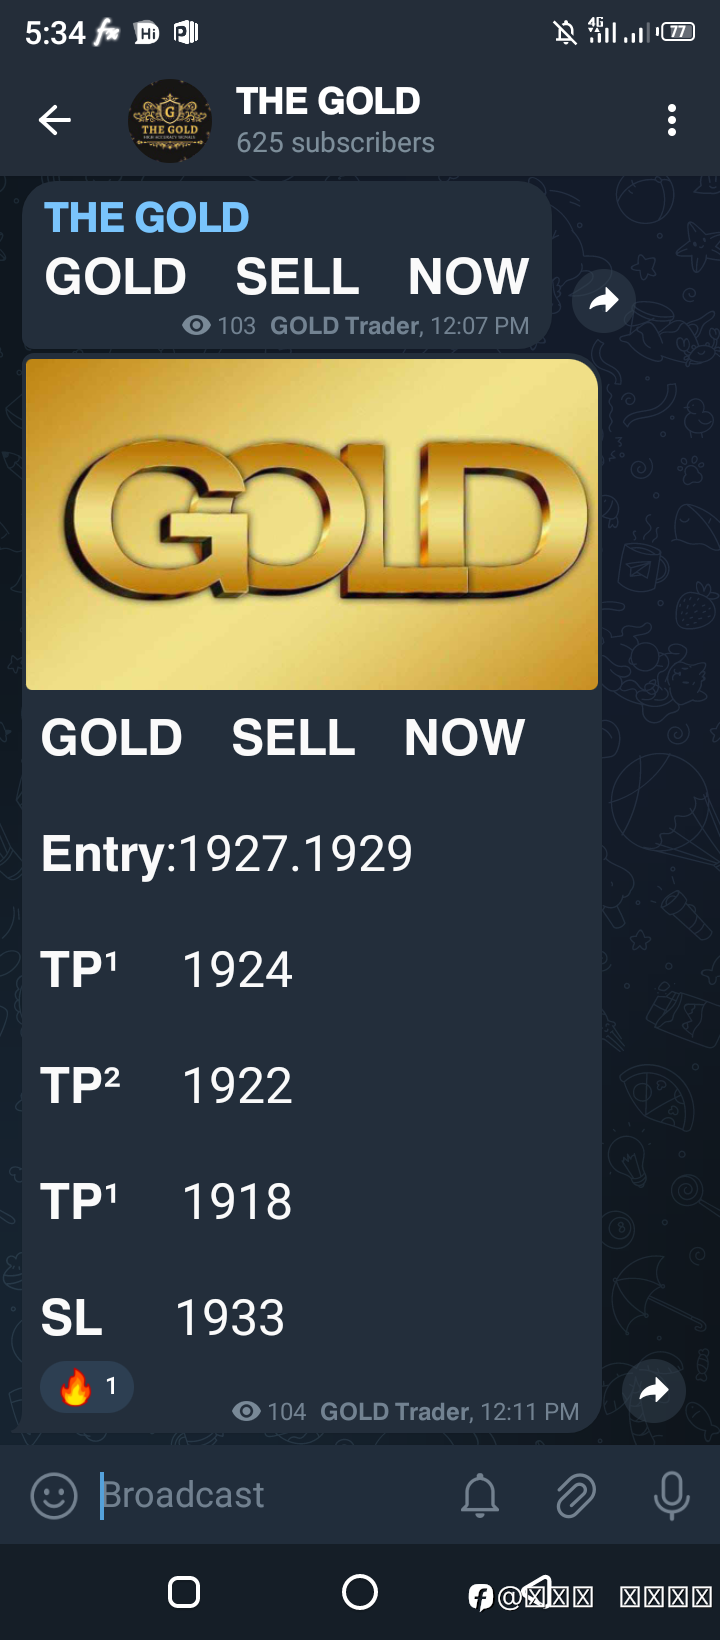
2023年10月02日
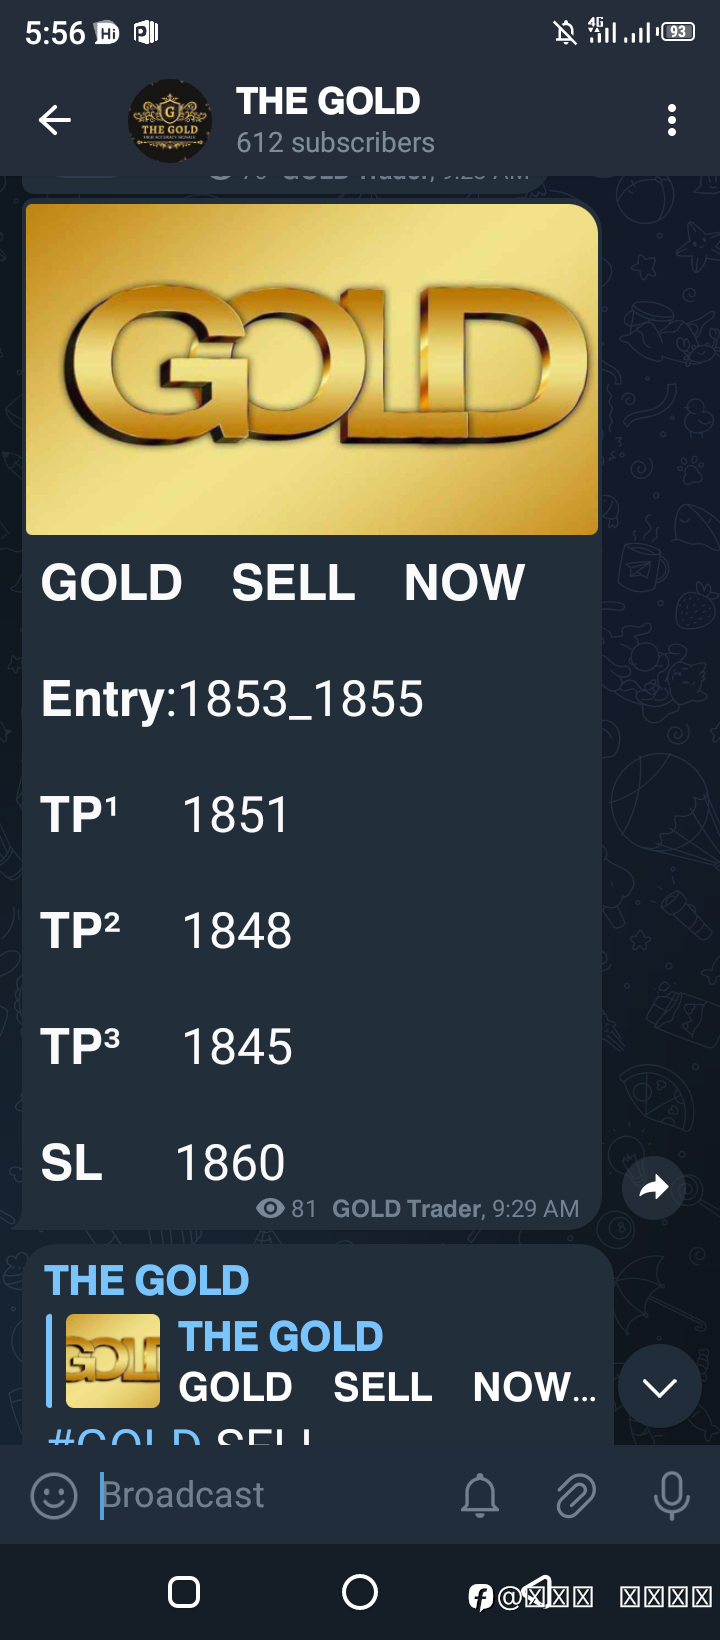
𝗚𝗢𝗟𝗗 𝗕𝗨𝗬 𝗡𝗢𝗪 𝗘𝗻𝘁𝗿𝘆_1832 𝗧𝗣¹ 1835 𝗧𝗣² 1840 𝗧𝗣³ 1842 𝗦𝗟 1827
𝗧𝗛𝗘 𝗚𝗢𝗟𝗗
2023年09月28日
Account Management Result
𝗧𝗛𝗘 𝗚𝗢𝗟𝗗
2023年09月27日
𝗚𝗢𝗟𝗗 𝗕𝗨𝗬 𝗡𝗢𝗪 𝗘𝗻𝘁𝗿𝘆_1894 𝗧𝗣¹ 1898 𝗧𝗣² 1902 𝗧𝗣³ 1905 𝗦𝗟 1888
𝗧𝗛𝗘 𝗚𝗢𝗟𝗗
2023年09月26日
GOLD ACCURATE SIGNAL
𝗧𝗛𝗘 𝗚𝗢𝗟𝗗
2023年09月23日
𝗧𝗛𝗘 𝗚𝗢𝗟𝗗
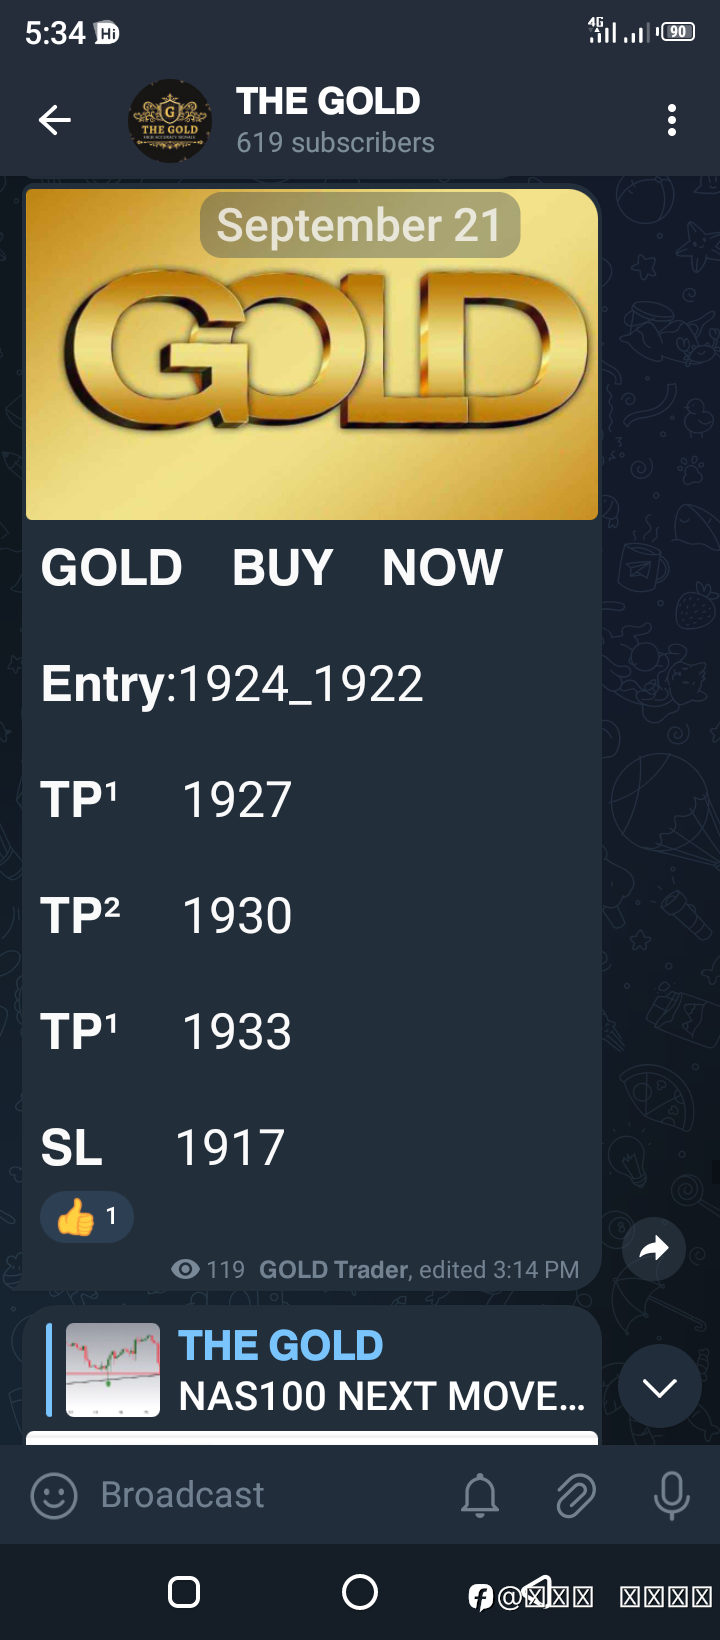
2023年09月21日
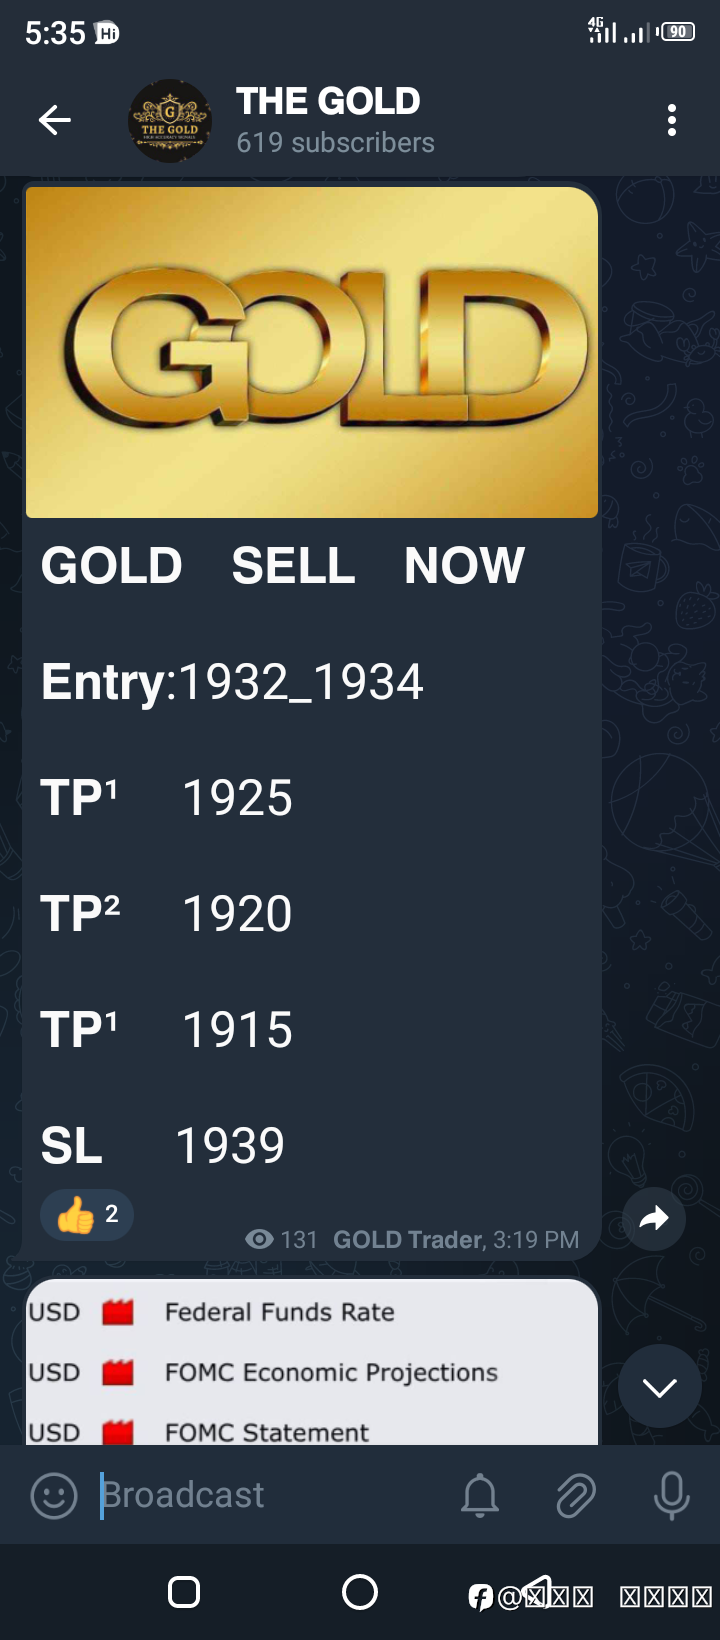
𝗚𝗢𝗟𝗗 𝗕𝗨𝗬 𝗡𝗢𝗪 𝗘𝗻𝘁𝗿𝘆:1914 𝗧𝗣¹ 1918 𝗧𝗣² 1922 𝗧𝗣¹ 1925 𝗦𝗟 1909
𝗧𝗛𝗘 𝗚𝗢𝗟𝗗
2023年09月21日
Management Result Account Management is available contact me
正在加载中...