Gold Maintains Stability on Tuesday, Anticipating US Inflation Signals Amidst Speculation of Rate Cuts
*Previous Week*
• On Thursday, gold made highs of 2047.95, however, minor correction was witnessed from highs and gold ended the trading day at 2031.21.
• On Friday, Gold made further corrections and ended the week near 2020 levels.
*Current Week*
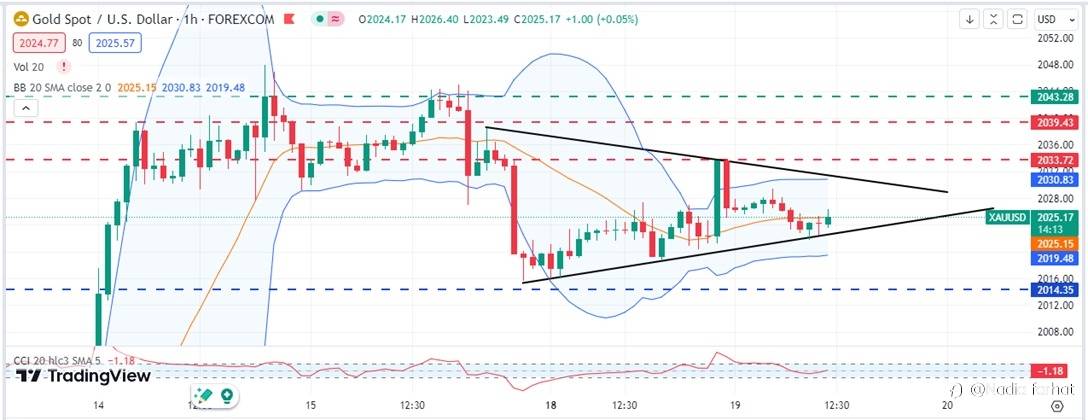
• On Monday, the price consolidated in a choppy fashion and seems to be creating a symmetrical triangle pattern. And the prices are hovering at the lower trend line of the triangle
• US Dollar fell substantially the previous week after the dovish Fed pivot, which drove gold towards higher levels. Investors often turn to gold as a hedge against currency depreciation.
• On Tuesday, BoJ announced its interest rate decision -> kept interest rate negative -> provide minor strength to USD -> further weaken gold
• However, gold prices initiate an upward bounce due to favorable technical factors.
• Furthermore, bullish sentiments favoring gold receive support from geopolitical risks and concerns regarding an economic slowdown in China.
*Current Situation*
• The price on Tuesday consolidates in a choppy manner, appears to be moving in a symmetrical triangle pattern.
• Currently, prices are hovering around the lower trend line of the triangle, with further weakness in prices near the 2024 mark.
*Technical Indicators:*
• Gold is currently trending in a buying zone as per technical indicators, which signals further bullishness.
• Gold on Monday hovers above the middle band of the Bollinger Band as visible on the attached H4 chart.
• The CCI levels also hover in the buying zone near 18.70 levels.
*Projection:*
• Gold looks uncertain, take your trades very cautiously.
• The choppy movement will continue till the US session, in which important Building Permits data will be released
*Important Levels to Watch*
*It is noteworthy that our previously given levels during late November are still respected by the gold prices – as visible on the attached chart of Gold*
• Resistance: 2033.72
• Support: 2014.35
风险提示:以上内容仅代表作者或嘉宾的观点,不代表 FOLLOWME 的任何观点及立场,且不代表 FOLLOWME 同意其说法或描述,也不构成任何投资建议。对于访问者根据 FOLLOWME 社区提供的信息所做出的一切行为,除非另有明确的书面承诺文件,否则本社区不承担任何形式的责任。
FOLLOWME 交易社区网址: www.followme.ceo


加载失败()