
SPX500
Standard & Poor's 500 Index
6604.5
44.7
(0.68%)
Prices By FOLLOWME , in USD
数据
LOW
HIGH
6524.5
6608.1
1 W
+0.68%
1 MO
+1.23%
3 MO
-4.63%
6 MO
-3.66%
US major indices close lower across the board. S&P and NASDAQ break winning streak
5 day winning streak is over
The US major indices are closing lower across the board. The declines are led by the Dow industrial average. However the S&P index and NASDAQ index also fell smartly.
The Dow industrial average did not trade positive on the day.
The NASDAQ index traded up over 8
KVB Weekly Market Recap 📒✨
1️⃣ Bitcoin hit a new high, soaring past $75,000 after Trump’s win. 2️⃣ Tesla closed over $1 trillion on Friday, backed by Elon Musk’s support for Trump. 3️⃣ Major indices hit record highs: Dow up 3.57%, S&P 500 2.53%, NASDAQ 2.95%. Investors are optimistic about tax cuts and deregulation, thoug


EBC Markets Briefing | Wall St resilient; Disney concerns jeopardized shares
Wall St opened the new month higher on Monday, with focus shifting to Nvidia. According to WSJ, the chipmaker's plans to pour $100 billion into OpenAI had stalled on doubts over potential benefits. Deutsche Bank said earnings growth is on track to be the strongest in four years. So far, about one-th


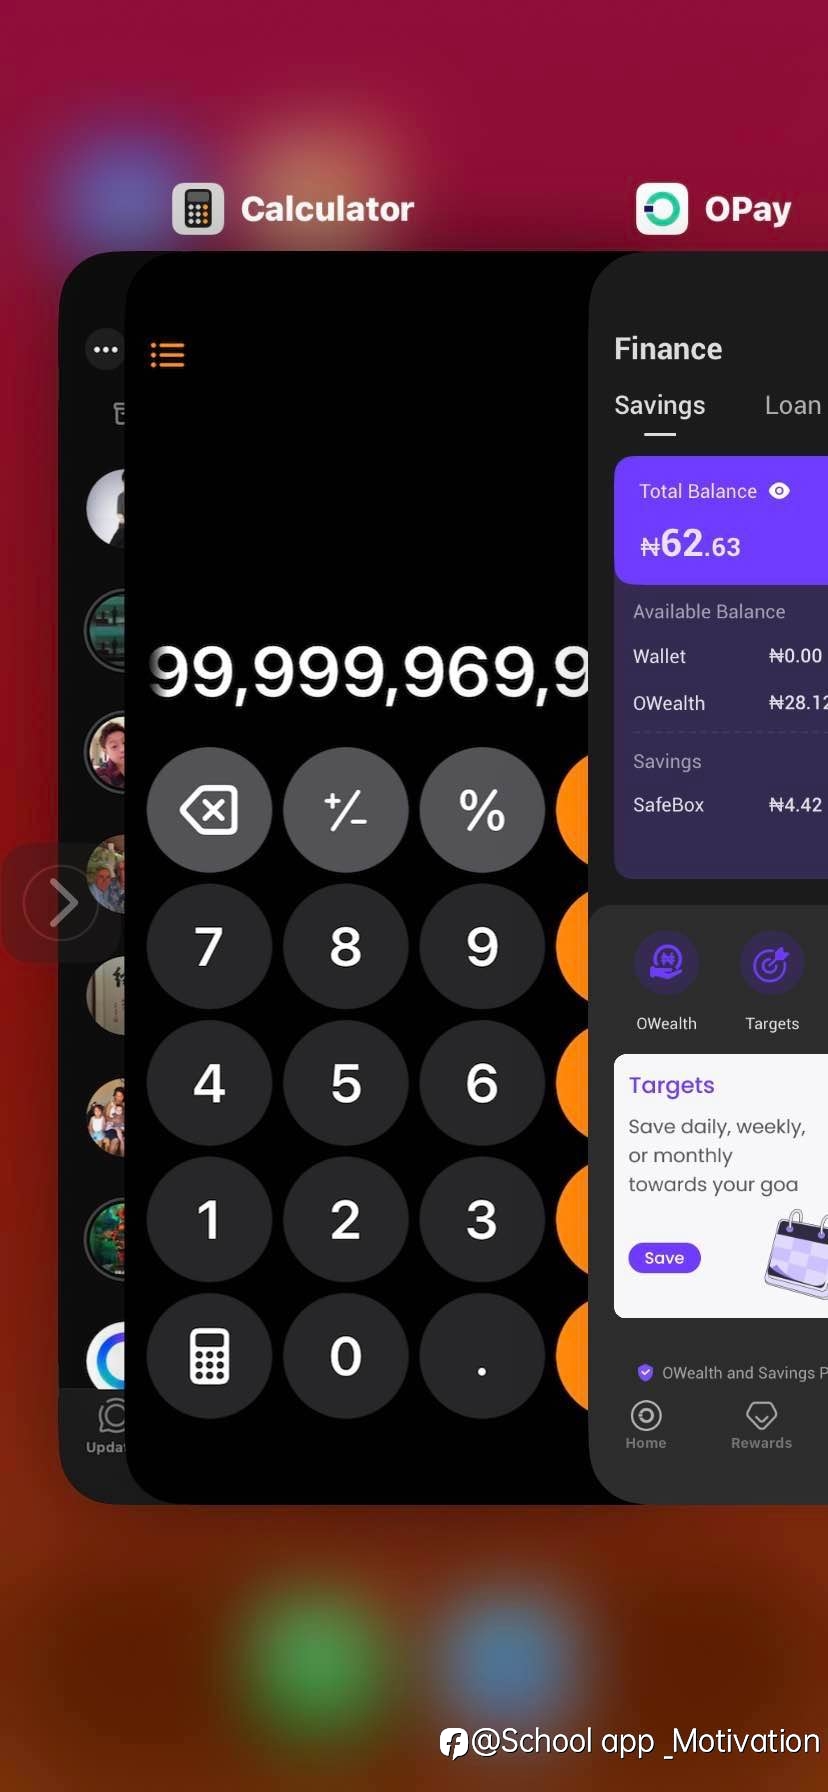
- School app _Motivation :Every ten minutes
South Korea Bourse Poised To Extend Its Gains
The South Korea stock market on Wednesday ended the three-day losing streak in which it had fallen almost 60 points or 2 percent. The KOSPI now sits just beneath the 2,990-point plateau and it may add to its winnings on Thursday. The global forecast for the Asian markets is upbeat following results
EBC Markets Briefing | Wall St wallows; Berkshire endorses Alphabet
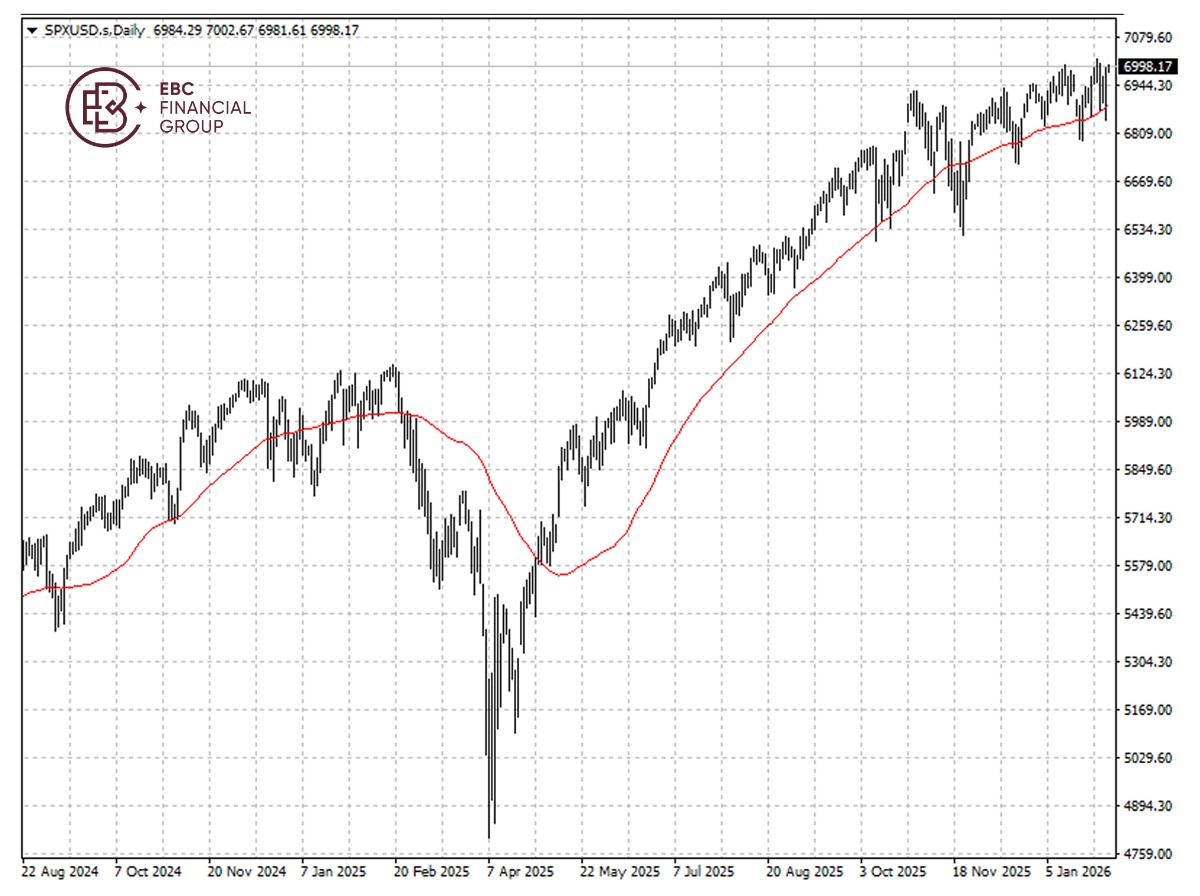
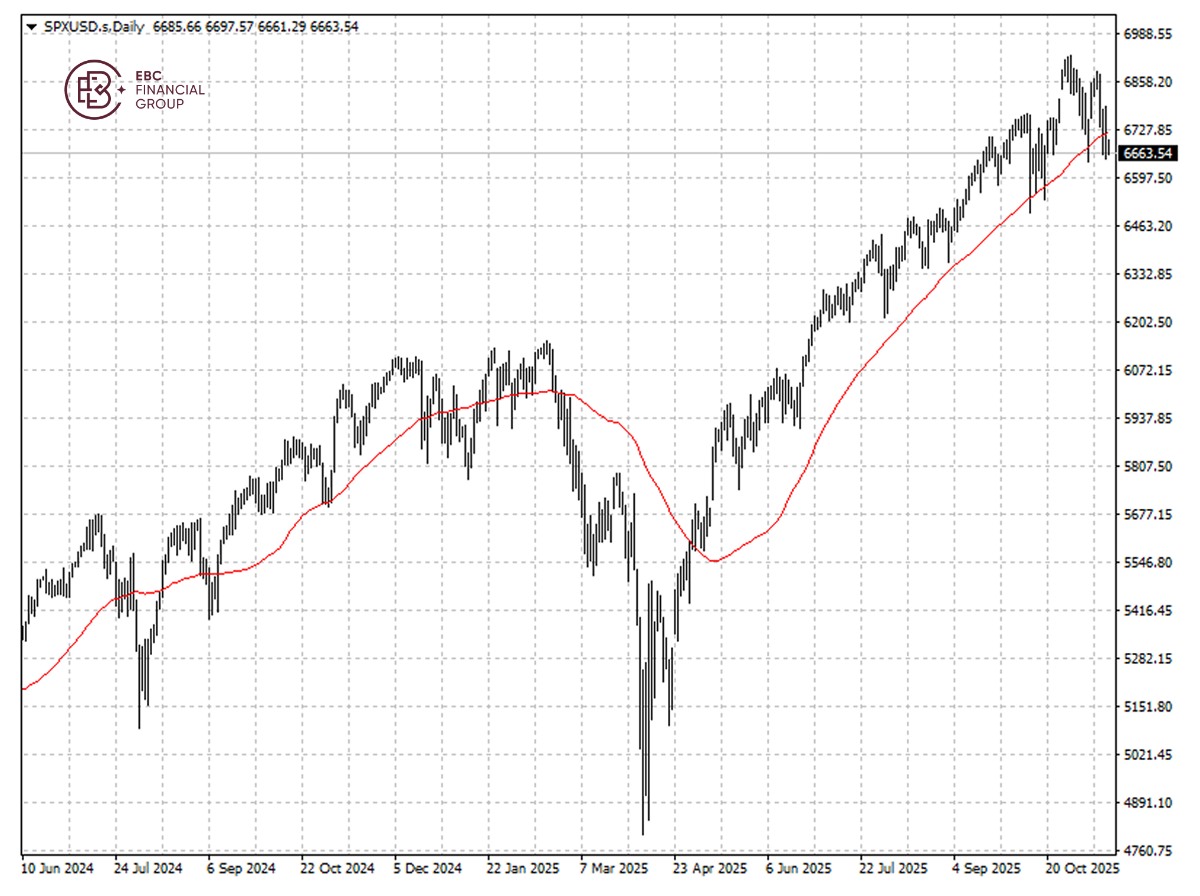
US stocks ended down sharply on Monday, with the S&P 500 closing below a key technical indicator for the first time since April, as optimism following the end of government shutdown faded. Trade Representative Jamieson Greer said on Friday that Trump was ready to follow through with pledges to g


What Are The Best Indices To Trade?
There is a wide range of stock indices available to trade today. Some of the most popular indices among traders include: The Dow Jones Industrial Average (DJ30): Launched in 1885, the Dow Jones is one of the oldest stock indices in the world. It comprises 30 large publicly-owned companies in the US.
- Fernandez Morgan :All thanks to this company getting my first profits of $9.000 was a grateful day reach her now on Instagrám Henriella Geoffrey fxtrade
- zarewa188 :hello


正在加载中...
