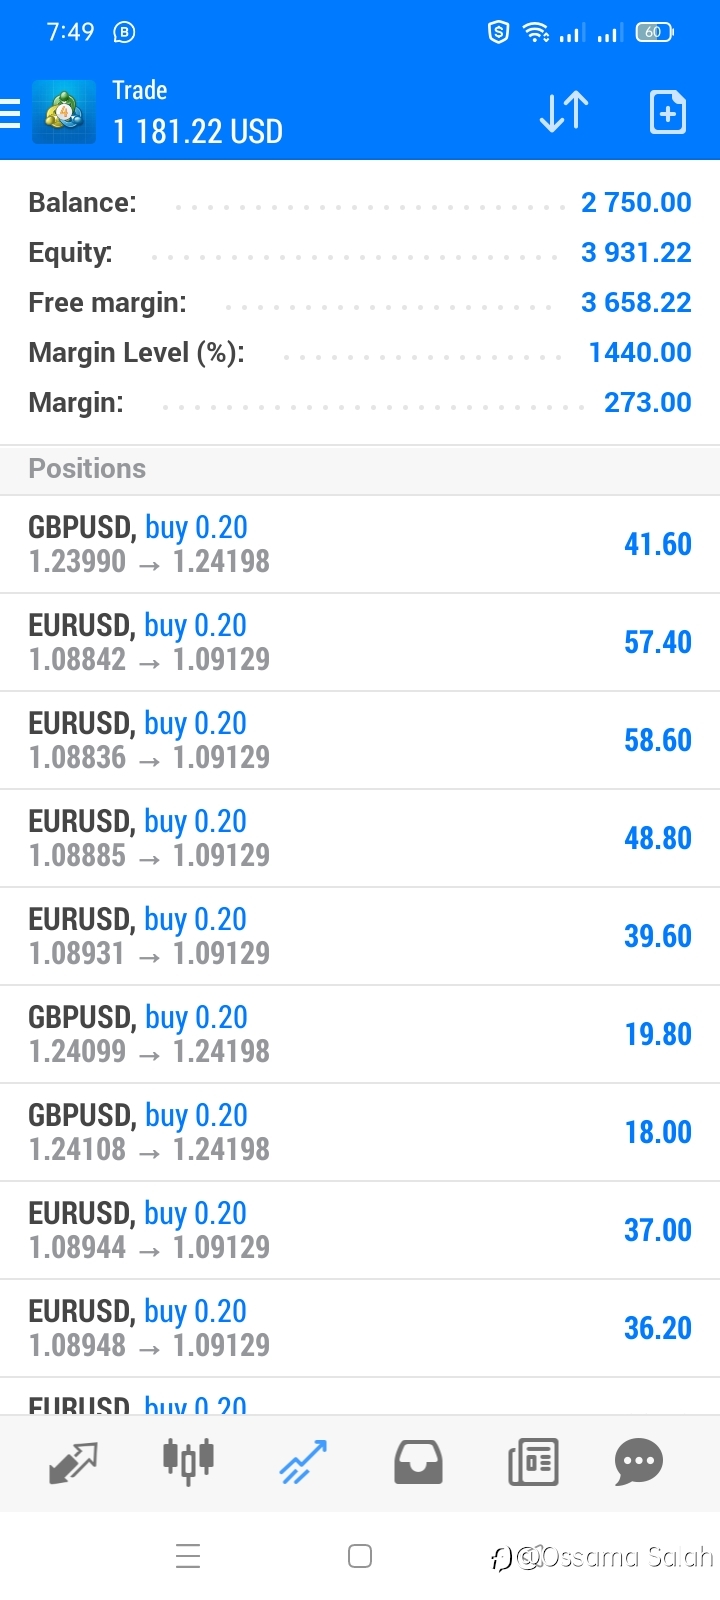
#BullishSentiment#
1.19k 浏览
378 讨论
Market sentiment refers to the overall attitude of investors toward a particular security or financial market. In broad terms, rising prices indicate bullish market sentiment.

- eddi clack :hi
- eddi clack :how are you doing today
EUR/USD before the FED
Today, an important comment from the FED on fiscal policy. The market expects nothing to change. The EUR / USD is in a continual correction after the recent decline on April 26. Always before a FED meeting, traders take profits in fear of a policy change. For me, this is a chance to buy EUR / USD at


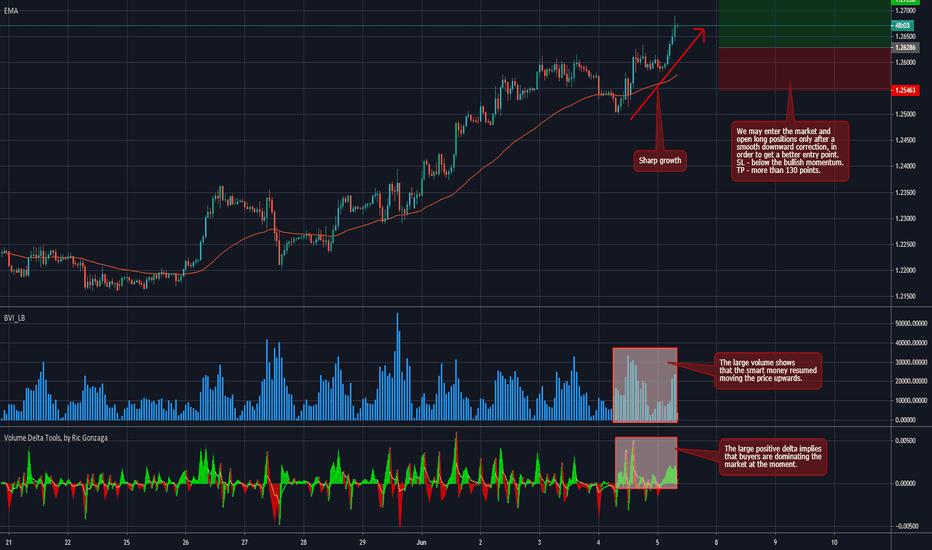
GBPUSD LONG on Order Flow - Follow the smart money!
#GBP/USD#
GBPUSD LONG on Order Flow - Follow the smart money!
Strong Bullish Signal: The Pound demonstrated an abrupt and sharp growth supported by the large volume and positive delta. Moreover, the pair has already broke out the previous resistance level . All these factors show the
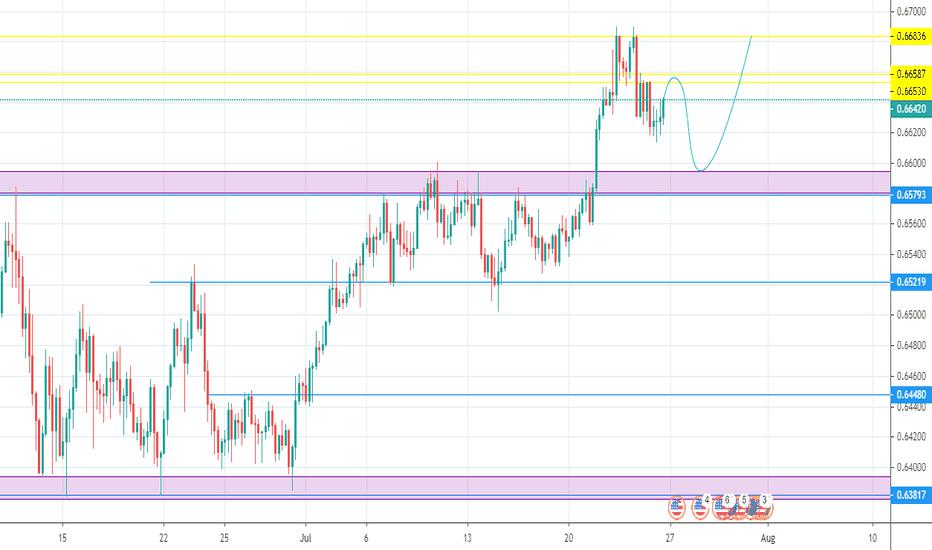
Nikkei bullish price action is targeting W H5 camarilla
The Nikkei has formed an inverted head and shoulders pattern. The price is bullish and the pattern might provide a breakout to the upside.
22600-650 is the POC zone. We can see the bottom of the right shoulder as the price is trying to bounce. The first target is the trend line confluence around D H

USD/CHF Price Analysis: Wednesday’s bullish engulfing suggests scope for a rise to 0.95
USD/CHF's daily chart shows a bullish candlestick pattern and RSI divergence.
A move to 0.95 could be in the offing.
USD/CHF is trading at 0.9453 at press time.
The pair created a bullish engulfing candle on Wednesday, confirming a reversal higher from the downtrend from the March high of 0.9902.

Gold Price Analysis: Acceptance above $1775 is critical for the XAU bulls – Confluence Detector
Gold kicked-off a fresh week on the defensive amid the upbeat market mood, although held onto the $1770 level. The stimulus expectations led rally on the global stocks could likely weigh on the safe-haven. Key technical levels to watch.
The Technical Confluences Indicator shows that the yellow metal

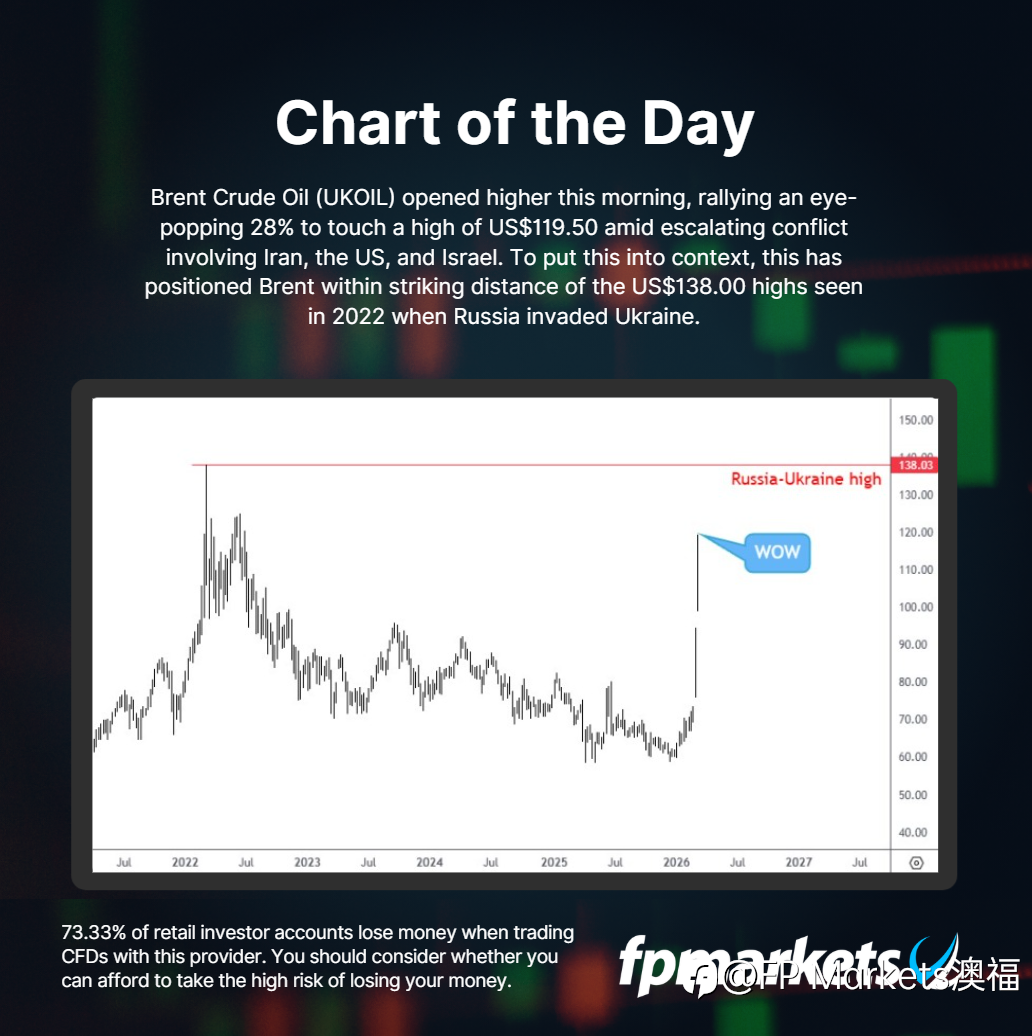
USOIL-Looking again for (X) or (4) to above 90$
#OPINIONLEADER# #ElliottWaves# #CrudeOil# #BullishSentiment# #howtotrade# #howtomasterforextrading# #ForexEducation# Market Commentary: 1. Looking for a sharp bounce in 5 wave structure to the me

- Followme :Weibo has obtained the basic prize in the Opinion Leader Program: 60 FOCIN that can withdraw. Click to know more details about //socia...
正在加载中...
