
📈 Phân tích thị trường: Vàng gần mức thấp nhất trong 8 tuần khi đồng đô la mạnh lên
Vàng đã ngừng giảm trong 4 ngày qua khi đồng đô la Mỹ mạnh lên tiếp tục gây sức ép lên giá, mặc dù dữ liệu lạm phát của Mỹ đã làm tăng kỳ vọng về việc Cục Dự trữ Liên bang sẽ cắt giảm lãi suất vào tháng tới. Sức mạnh của đồng đô la khiến vàng trở nên đắt đỏ hơn đối với người mua quốc tế. Giá vàng đã

Boost Your Trading with KVB Actstrade’s Advanced Chart Analysis! 📊
Enjoy a variety of chart types including area, line, and bar charts, along with up to 10 powerful indicators such as MA, RSI, KDJ, ATR and more. KVB Actstrade equips you with the tools to enhance your trading strategy and make more informed decisions. Take advantage of our tools—explore KVB Actstrad

Master the Markets with KVB App’s Insightful Features! 🤳
Leverage advanced market analysis, a detailed calendar, and up-to-the-minute flash news with KVB App. These essential tools ensure you make smart, informed trading decisions and stay ahead in the fast-paced financial world. Download KVB App now and take control of your trading success! 💪🏻

Mô hình Falling Three Methods và Rising Three Methods
1. Mô hình Rising Three Methods Nó đối lập với mô hình ba phương pháp giảm. Đây là một mô hình năm hình nến được quan sát trong một đợt tăng giá. Mô hình này cho thấy xu hướng tăng giá sẽ còn tiếp tục trên thị trường. Loại mô hình này thường hoạt động như một cái bẫy và những con gấu muốn tham gia t


How to Trade Bearish and Bullish Pennants
Similar to rectangles, pennants are continuation chart patterns formed after strong moves. After a big upward or downward move, buyers or sellers usually pause to catch their breath before taking the pair further in the same direction. Because of this, the price usually consolidates and forms a tiny


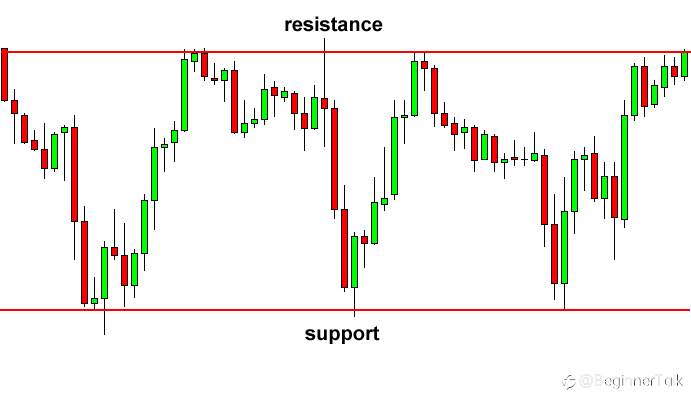
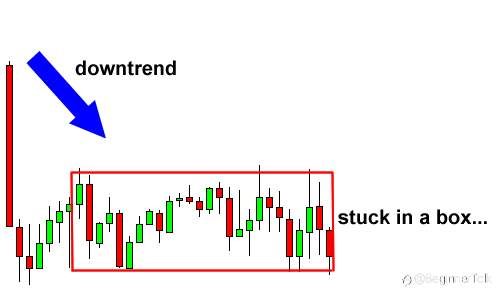
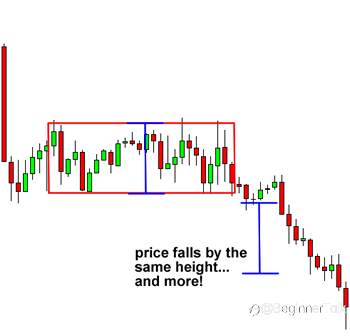
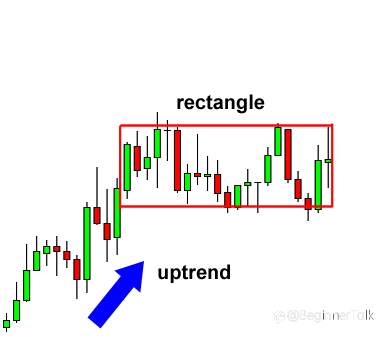
How to Use Rectangle Chart Patterns to Trade Breakouts
A rectangle is a chart pattern formed when the price is bounded by parallel support and resistance levels. A rectangle exhibits a period of consolidation or indecision between buyers and sellers as they take turns throwing punches but neither has dominated. The price will “test” the support and resi
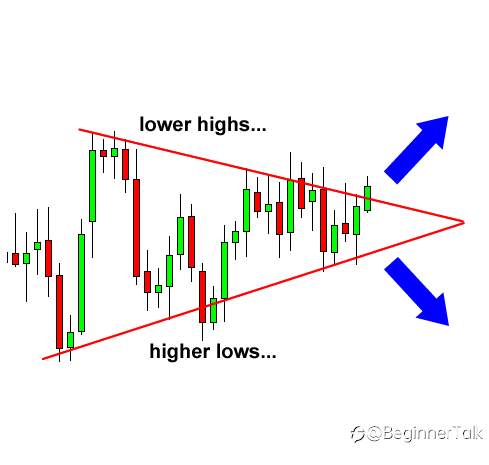
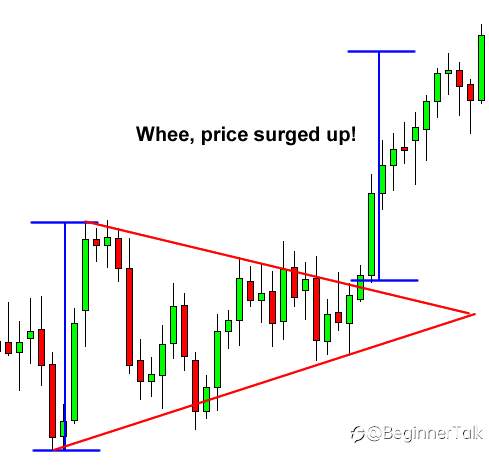
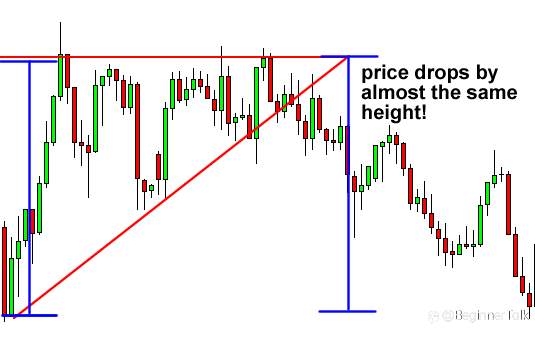
How to Trade Triangle Chart Patterns
A triangle chart pattern involves price moving into a tighter and tighter range as time goes by and provides a visual display of a battle between bulls and bears. The triangle pattern is generally categorized as a “continuation pattern”, meaning that after the pattern completes, it’s assumed th

正在加载中...
