
#Head-and-ShouldersPattern#
318 浏览
18 讨论
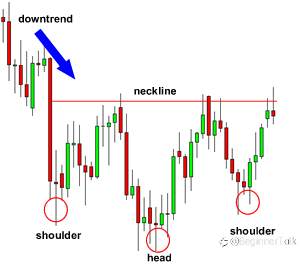
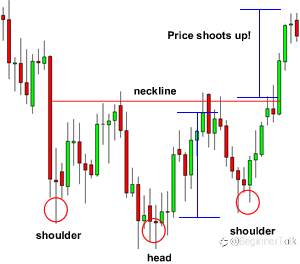
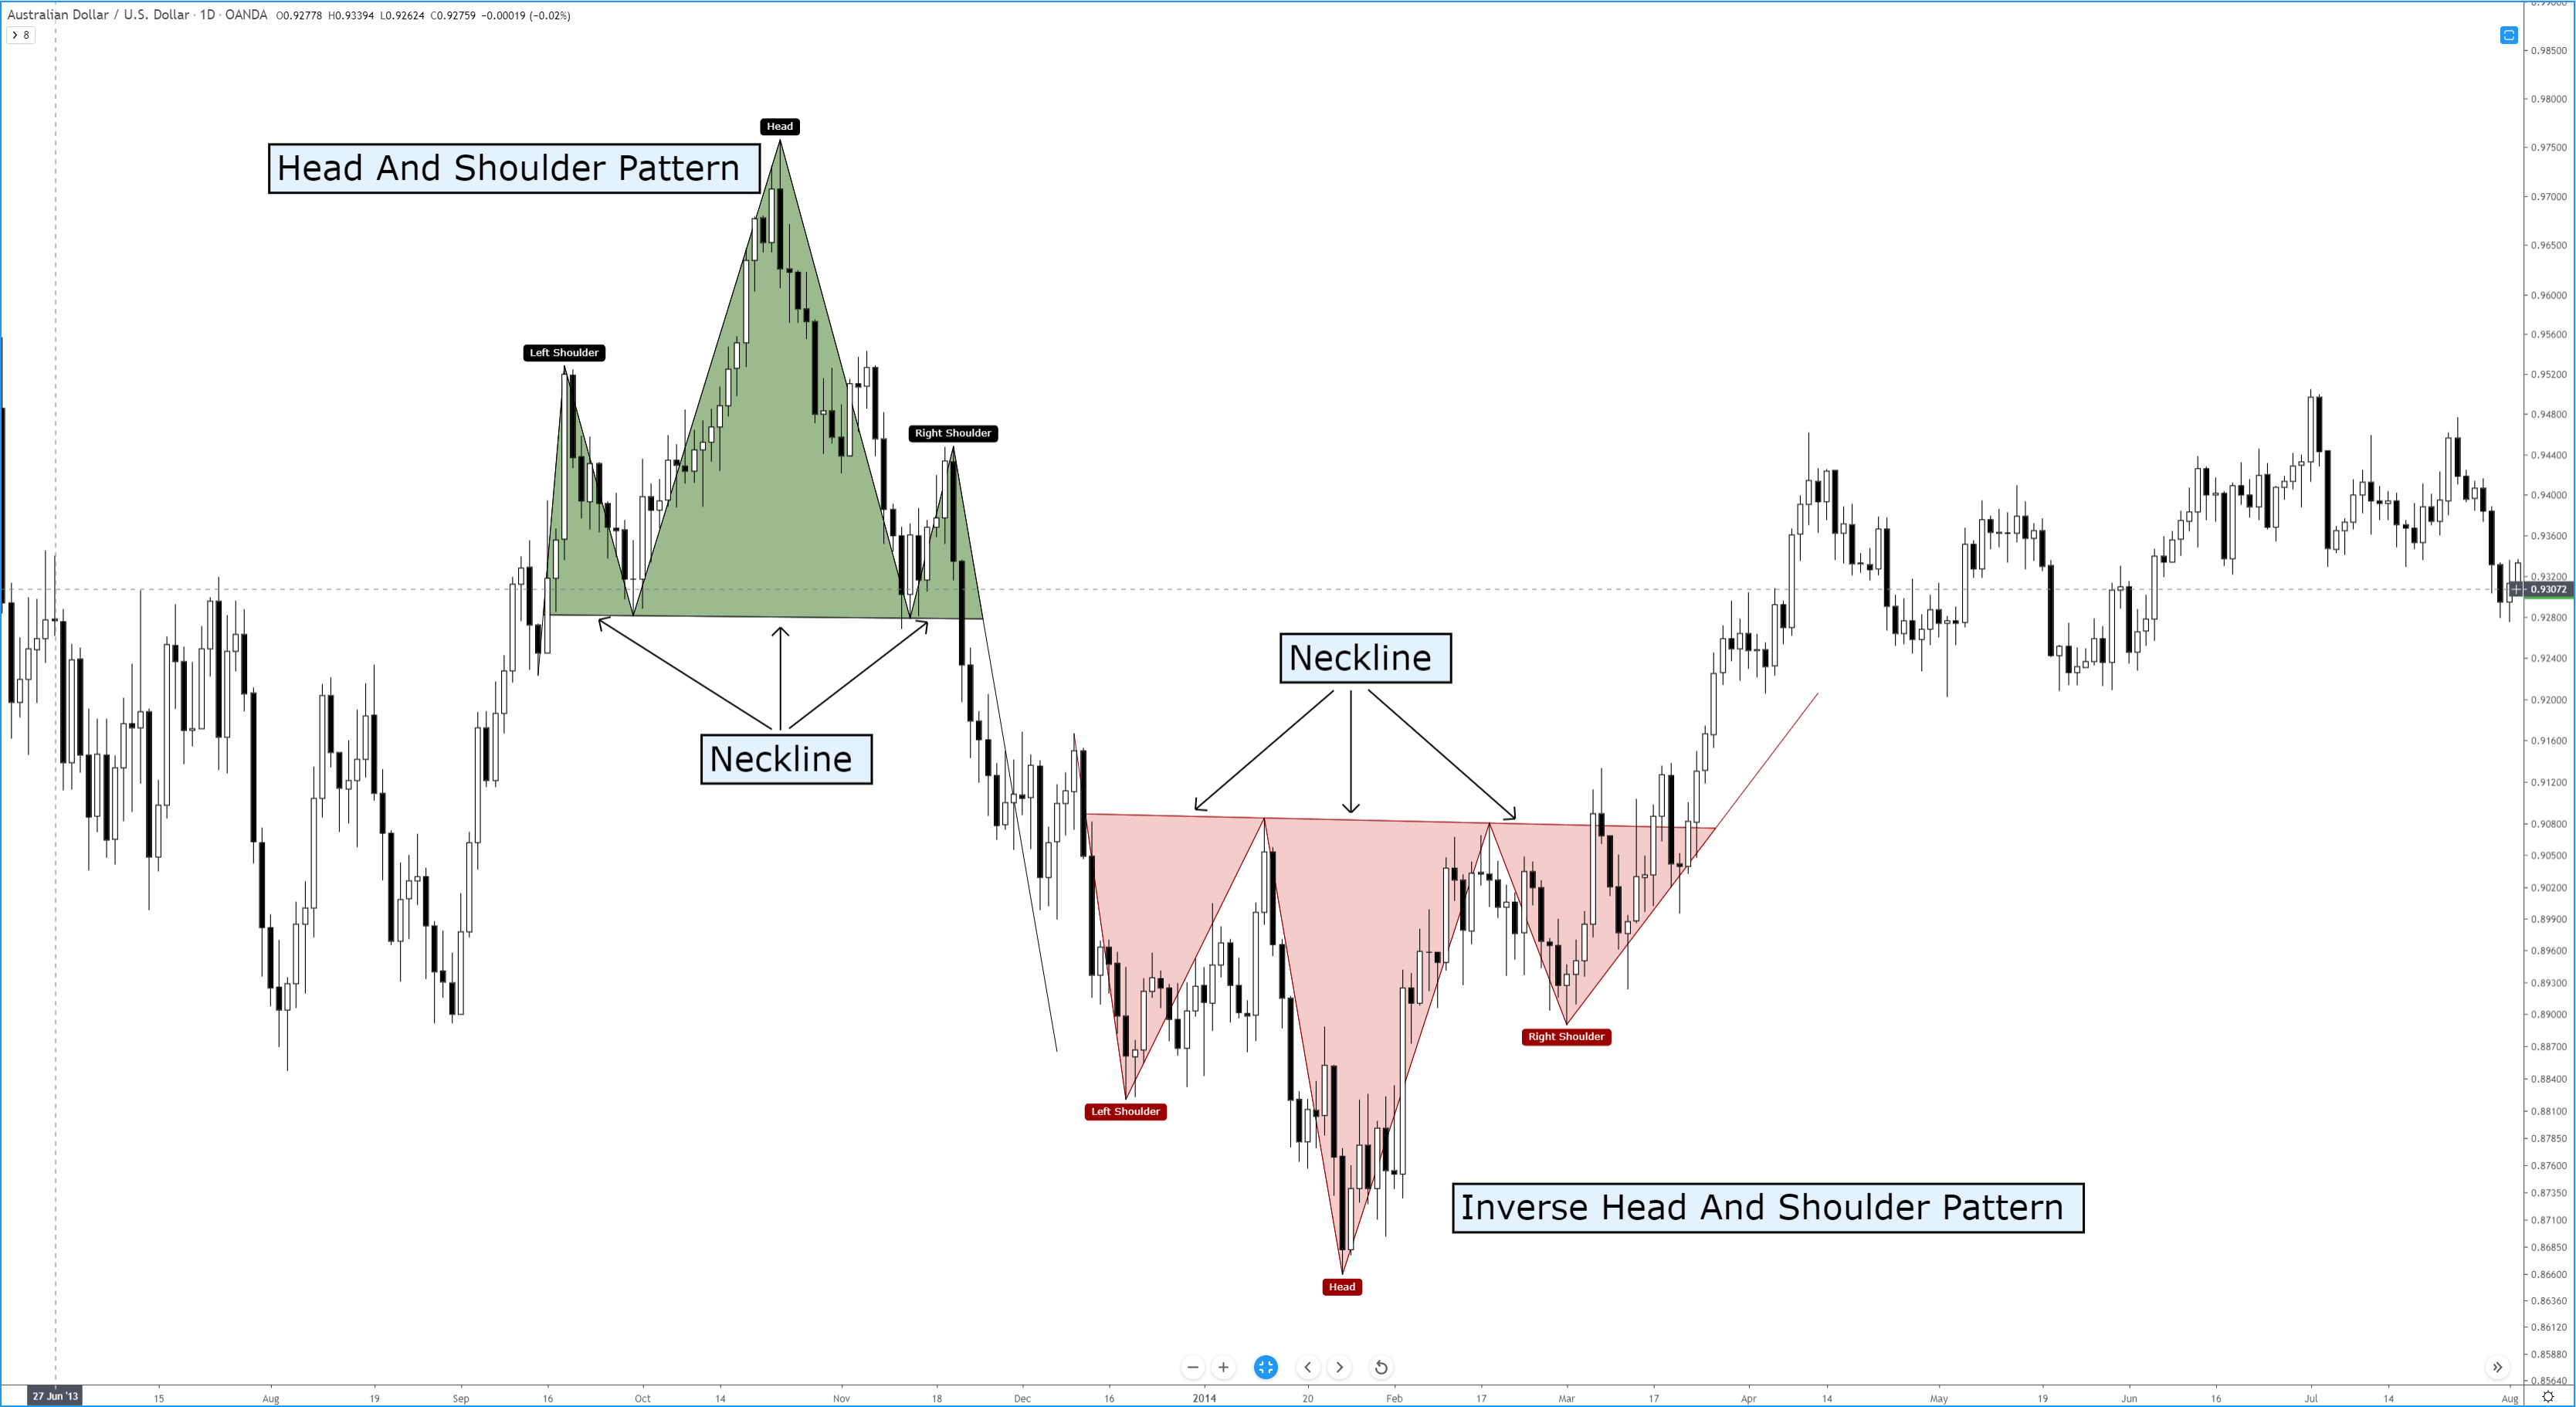
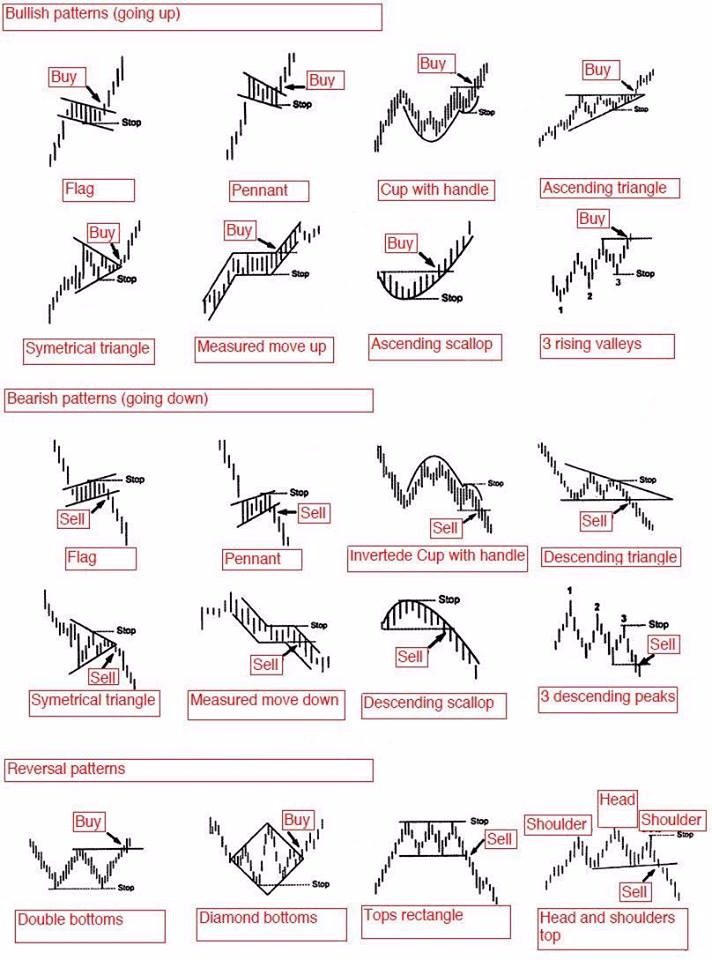
A head and shoulders pattern is a chart formation that resembles a baseline with three peaks, the outside two are close in height and the middle is highest. In technical analysis, a head and shoulders pattern describes a specific chart formation that predicts a bullish-to-bearish trend reversal.
Hampir Kejebak Pola
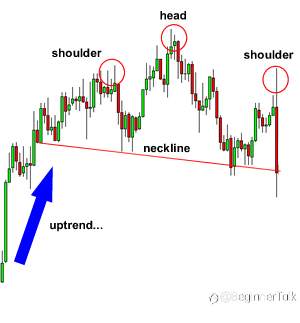
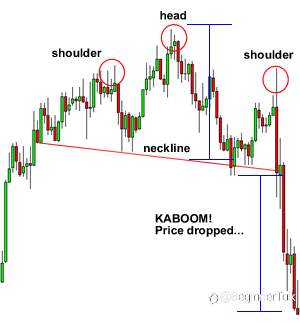
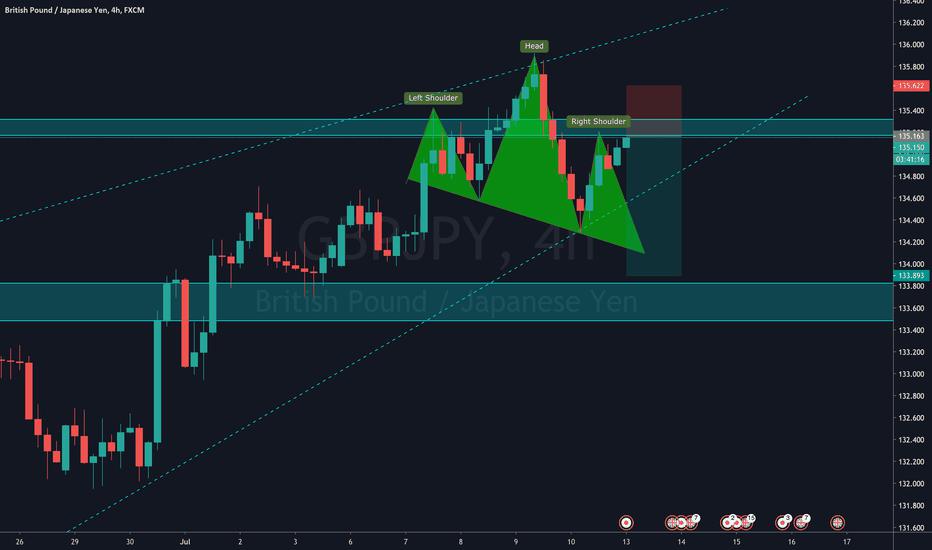
Gue dulu sering banget salah baca head and shoulders forex. Lihat tiga puncak, langsung mikir bakal reversal. Tapi setelah beberapa kali kena SL, baru sadar kalau momentumnya yang lebih penting, bukan cuma bentuk. Waktu lihat analisis trader lain di Followme.com, gue mulai ngerti gimana shoulder kan
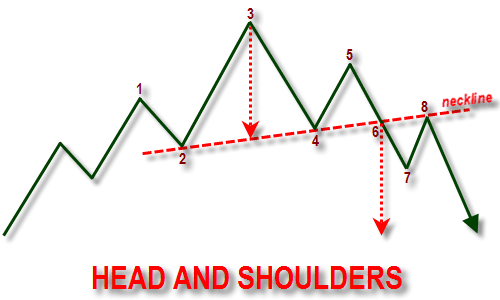
How to Trade the Head and Shoulders Pattern
The head and shoulders chart pattern is a reversal pattern and most often seen in uptrends. Not only is “head and shoulders” known for trend reversals, but it’s also known for dandruff reversals as well. 😂 In this lesson, we’ll stick to talking about trend reversals and leave the topic of dandruff
Reading Charts— How to Identify and Trade “Double Tops”
The double top chart pattern is a reversal pattern. It can be seen in charts of almost all time frames. It often forms when price approaches a resistance level after an extended rise. There price stalls near the previous swing high and is poised to pull back. Some traders would try to get in here.

正在加载中...
